with arrows, red edges, and blue vertices
All coordinates for the following graph drawings have been calculated using KaDraw:
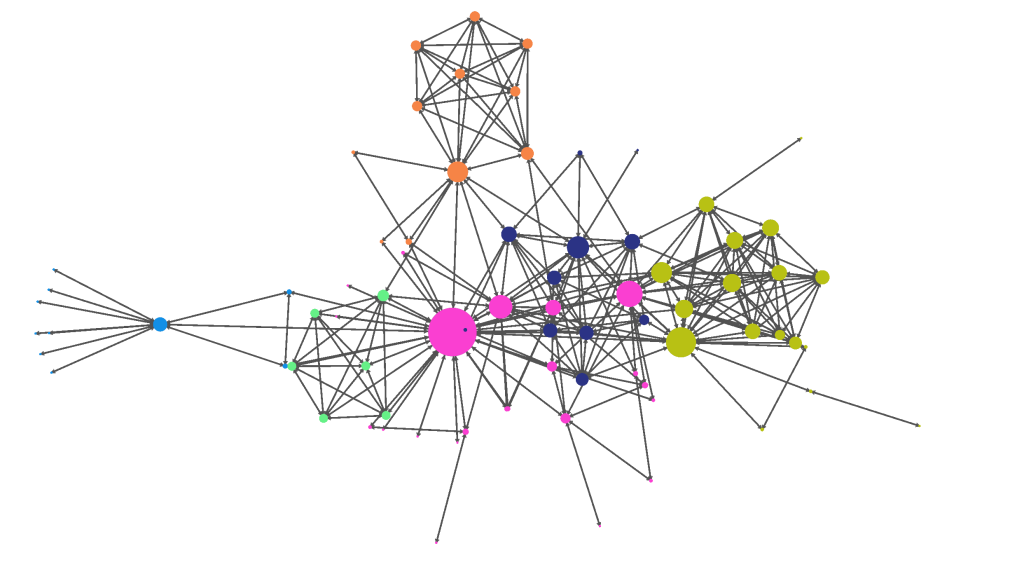
with vertices sized by degree and colored by cluster
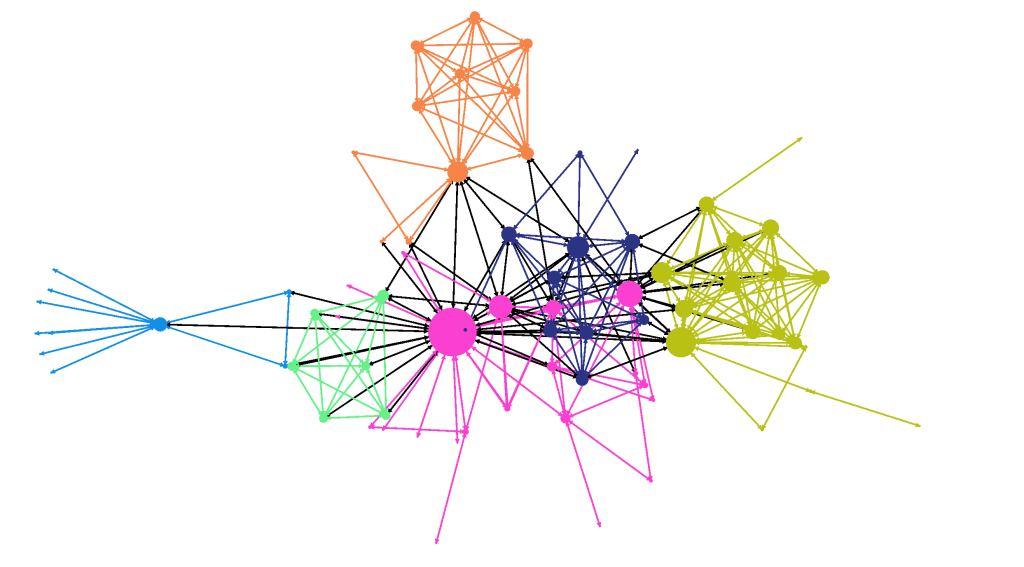
with vertices sized by degree and vertices+edges colored by cluster
Edges between custers shown in black
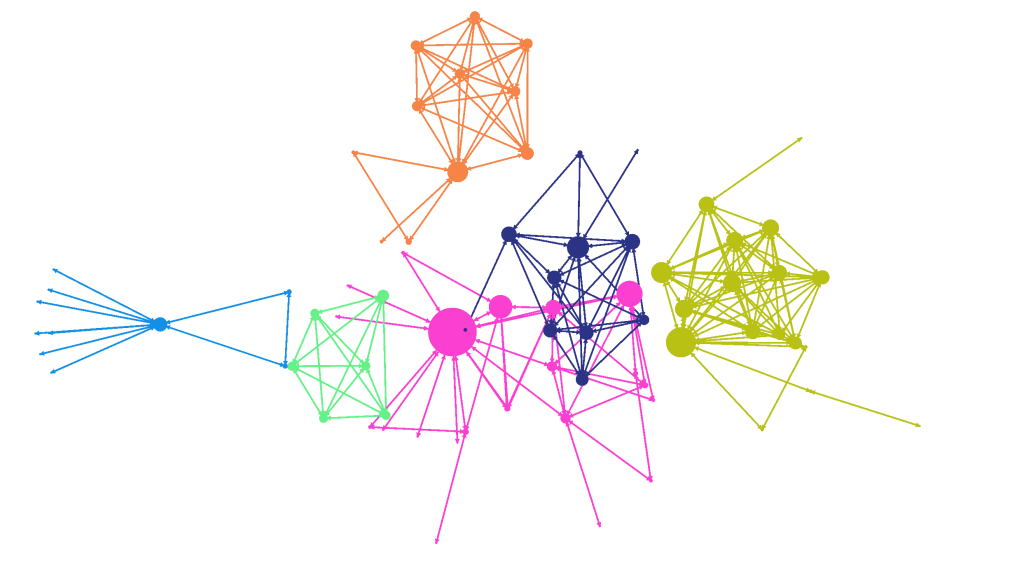
with vertices sized by degree and vertices+edges colored by cluster
Edges between custers removed
with vertices sized by degree
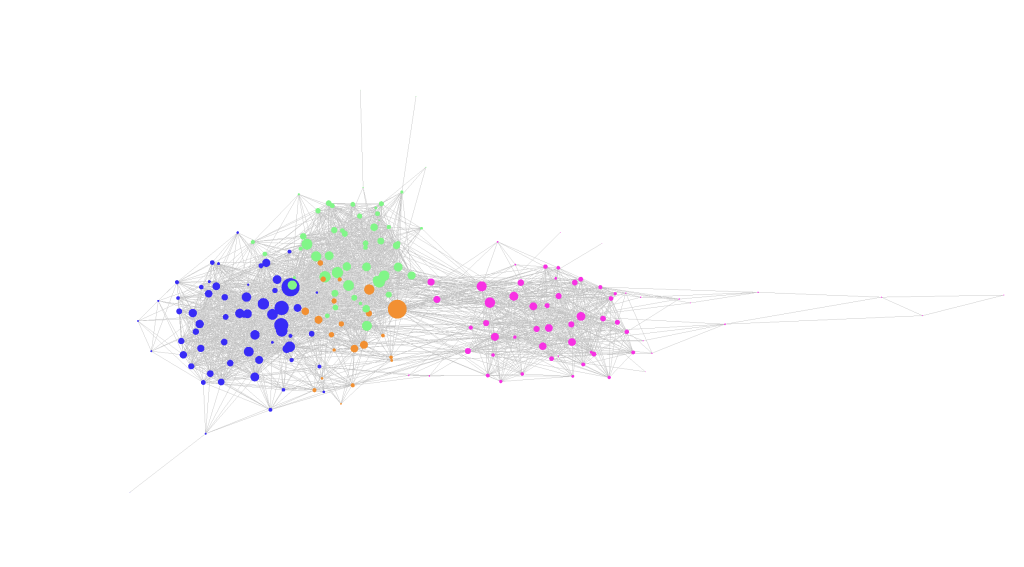
with vertices sized by degree and colored by cluster
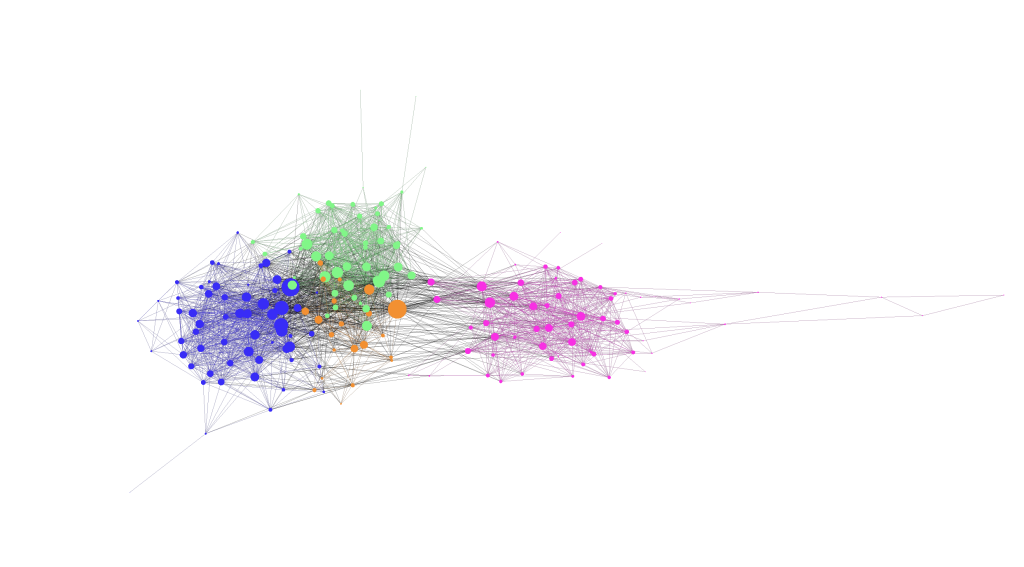
with vertices sized by degree and vertices+edges colored by cluster
Edges between custers shown in black
with vertices sized by degree
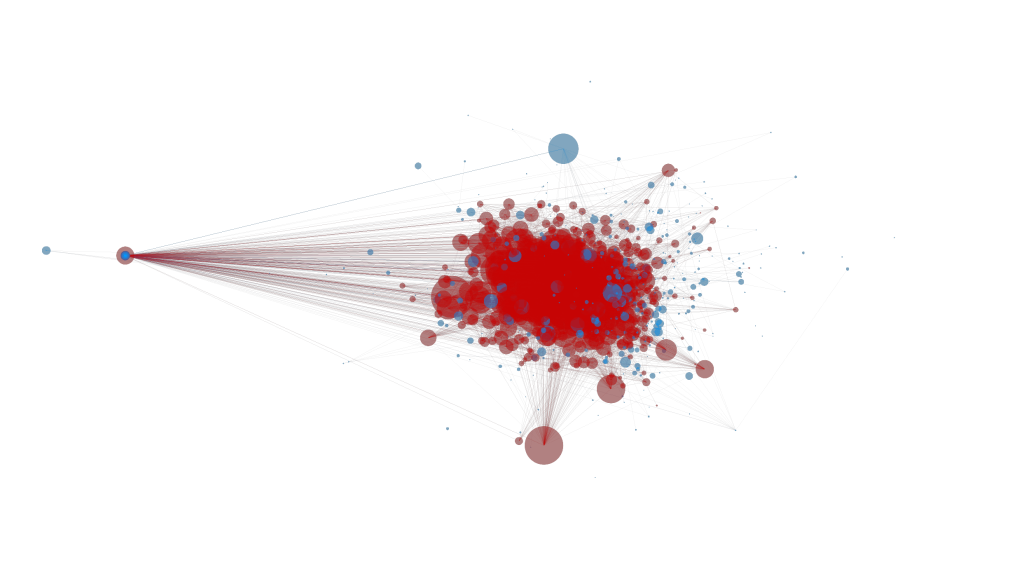
with vertices sized by degree, feedback vertex set (FVS), calculated by a random walk algorithm to optimality, shown in red, remaining vertices shown in blue
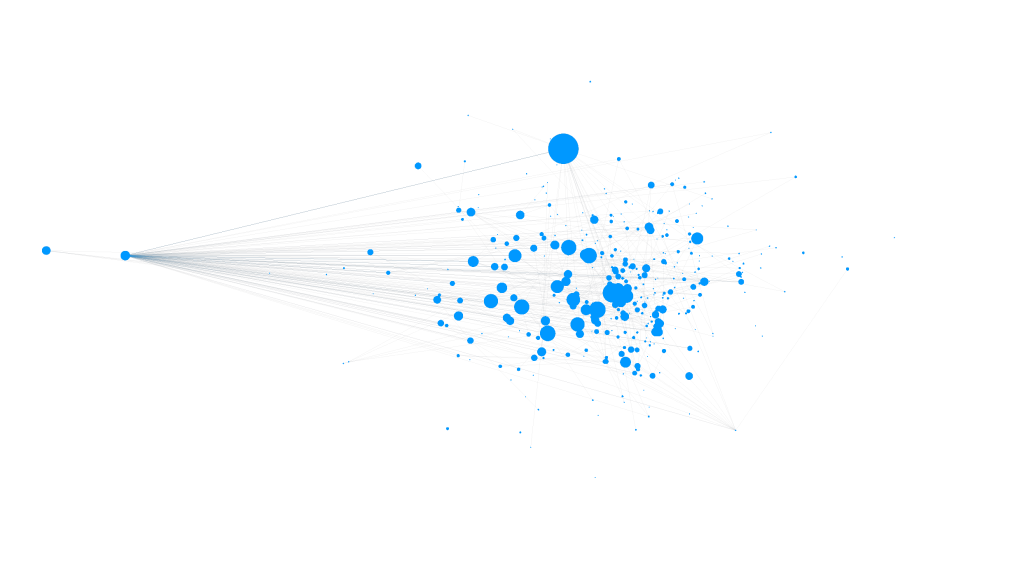
with vertices sized by degree, removed FVS, remaining vertices shown in blue
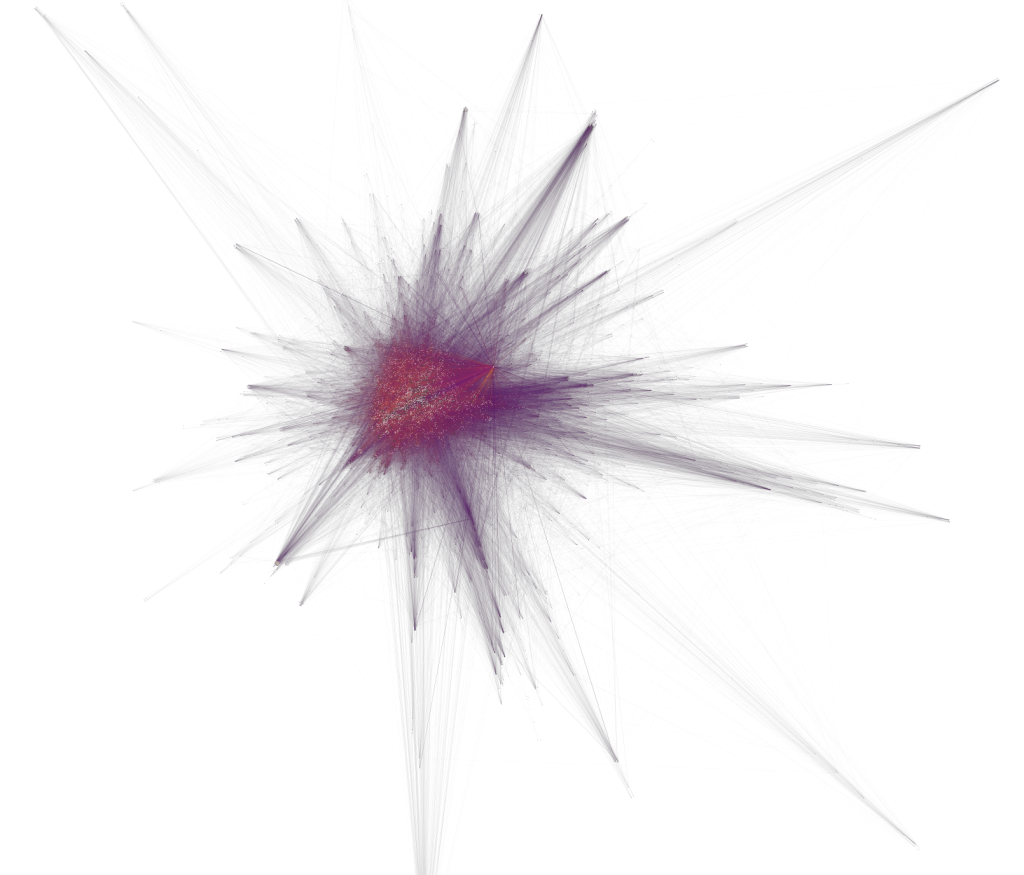
with vertices sized by degree, colored in red and edges colored by edge length (green=long, red=short)
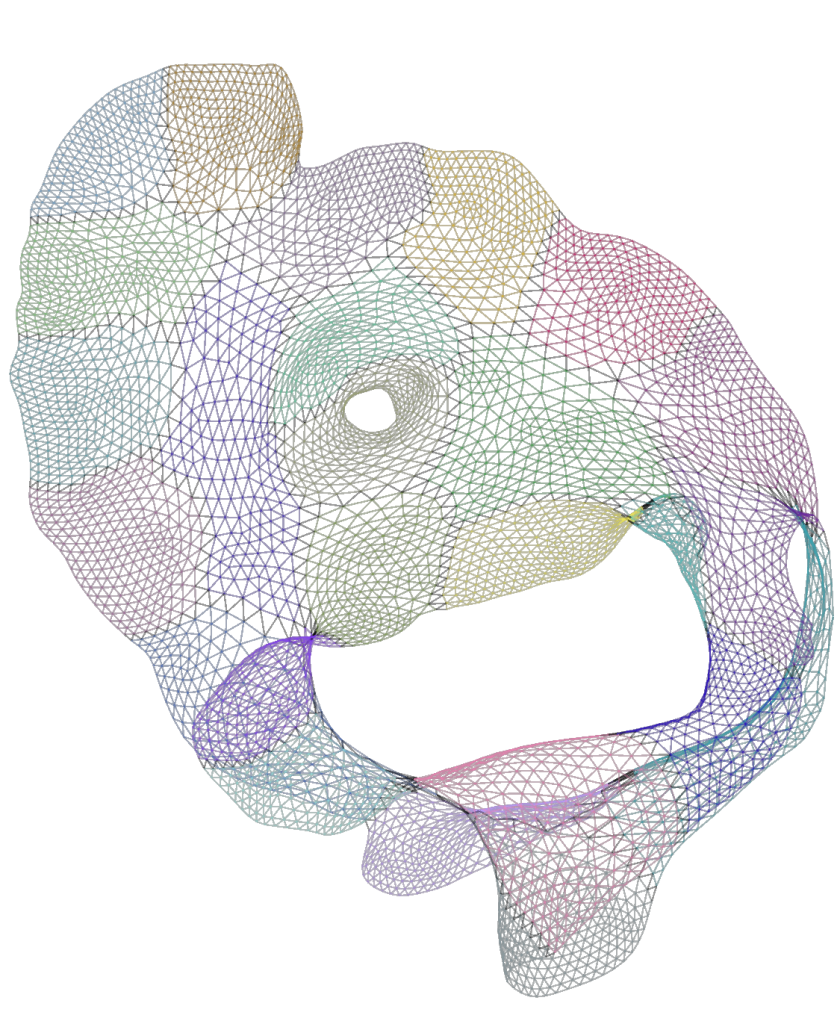
colored by partition (better visible with dark mode turned on),
edges between partitions shown in black
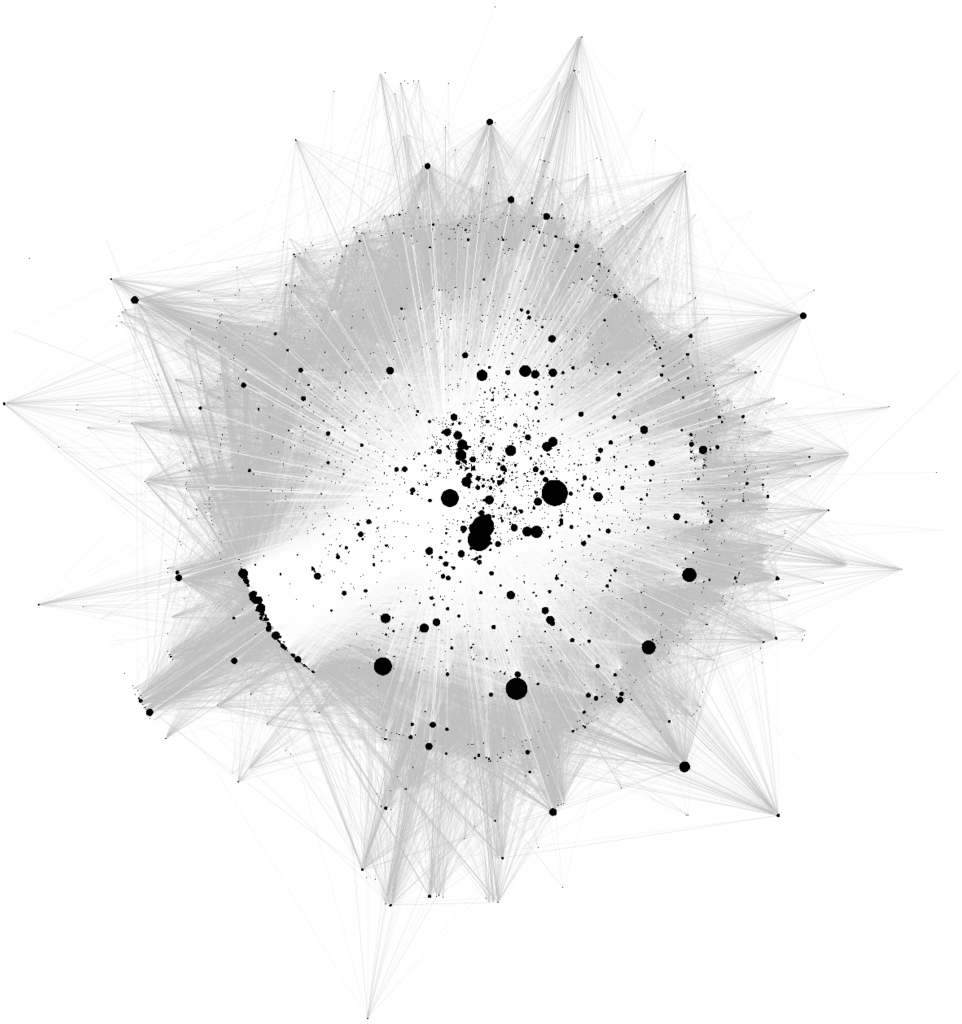
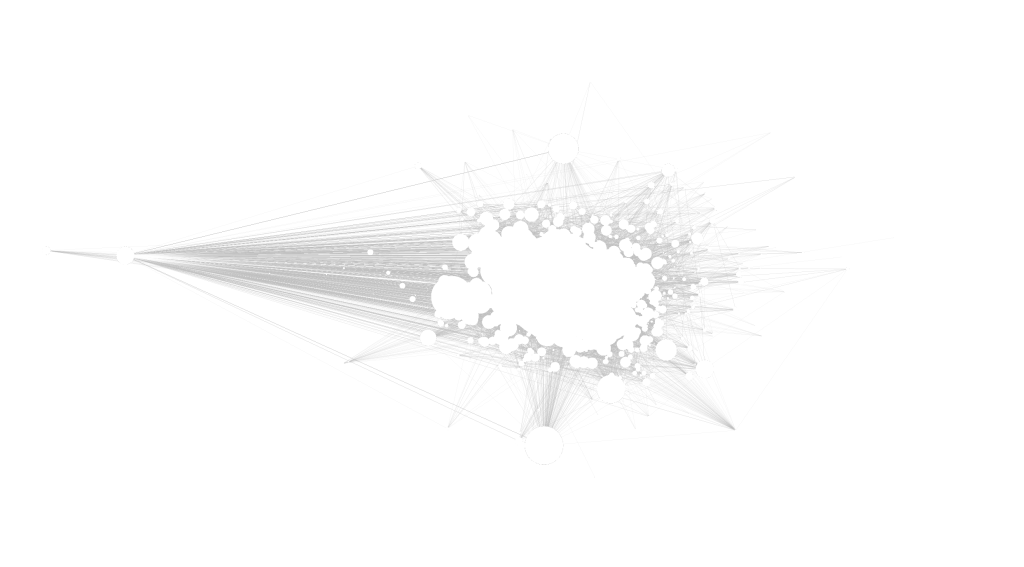
with vertices shown in black, edges in white
with vertices shown in white, edges colored by length quartile (plasma)
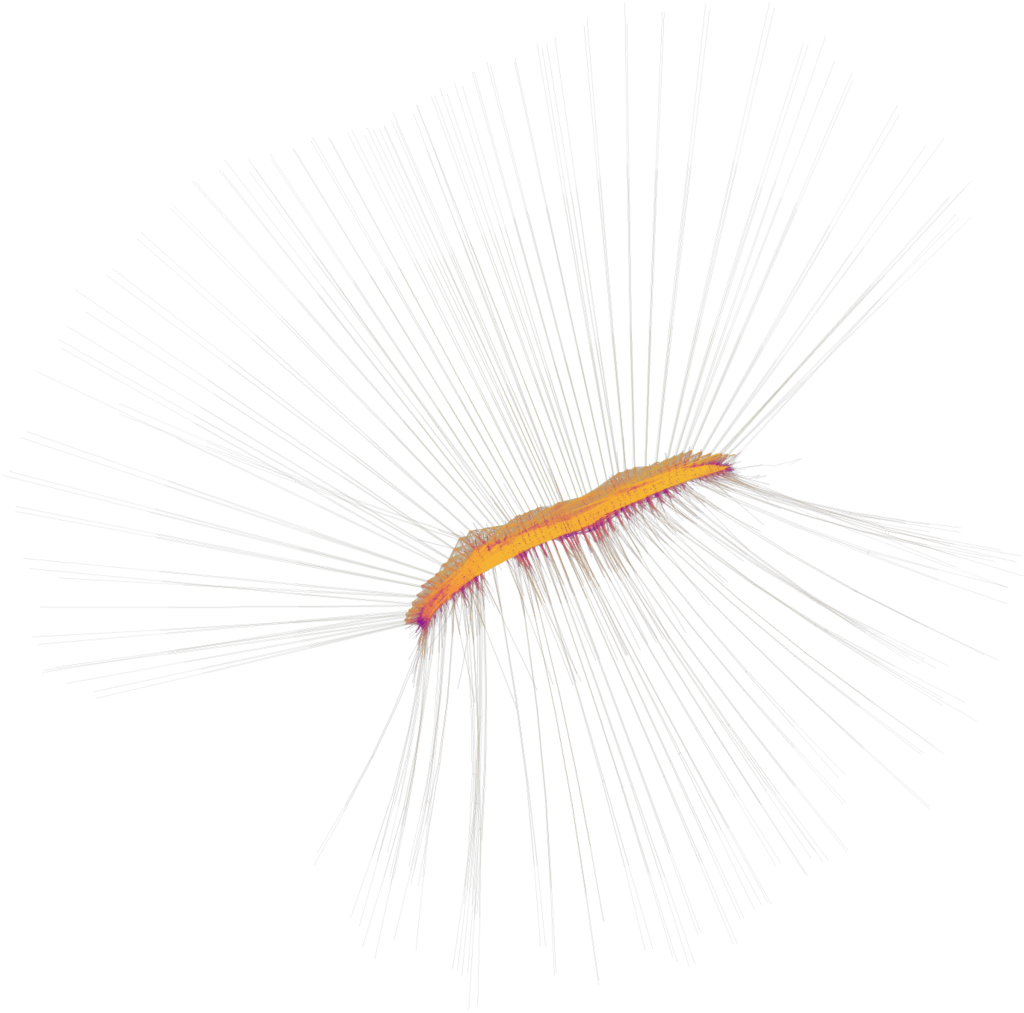
with vertices disabled, edges colored by length quartile (inferno)
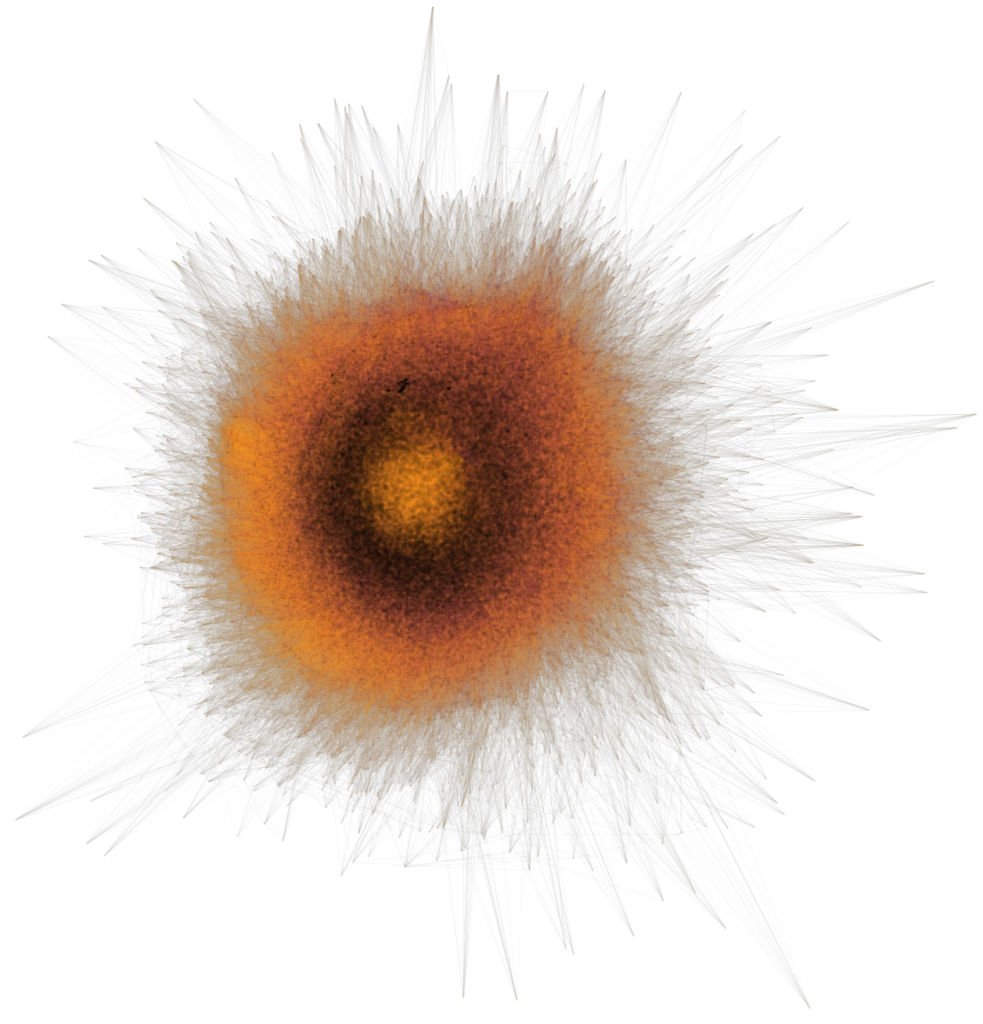
with vertices shown in black, edges colored by length quartile (inferno),
edge alpha = 0.05
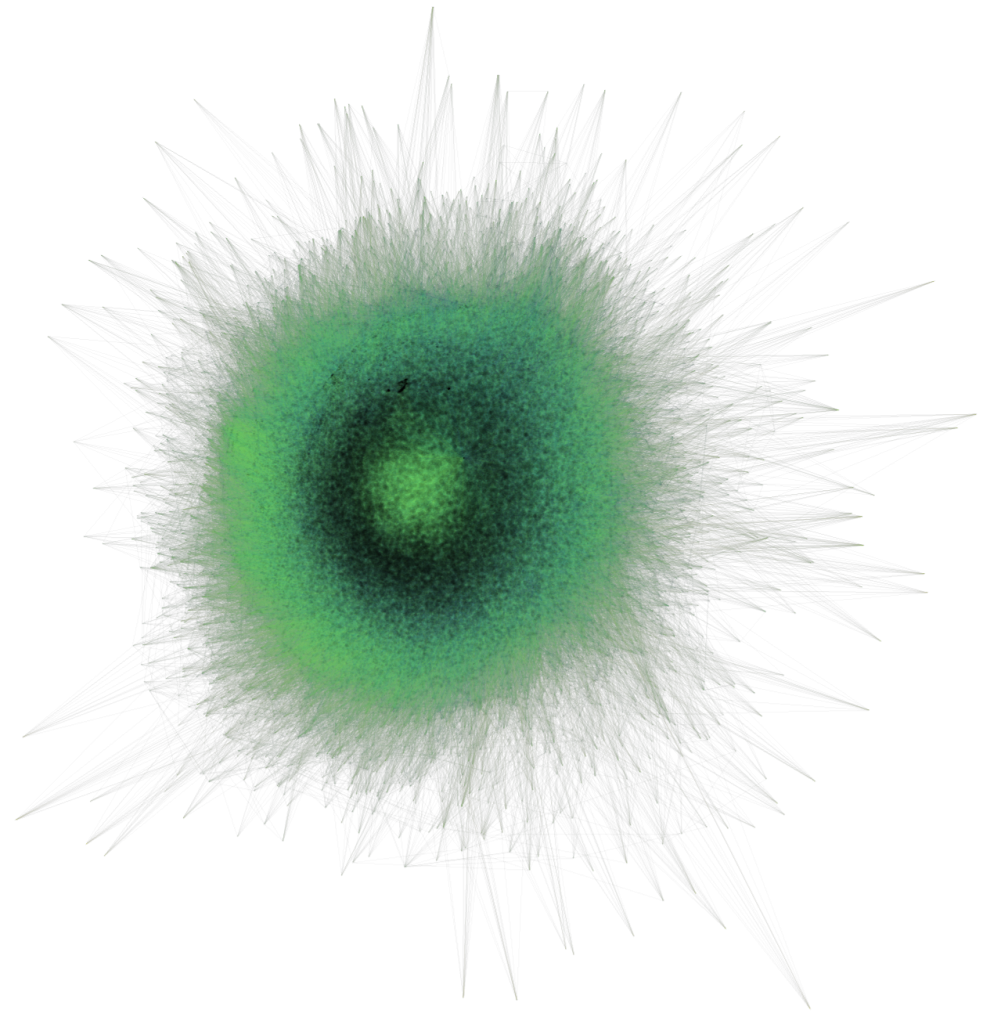
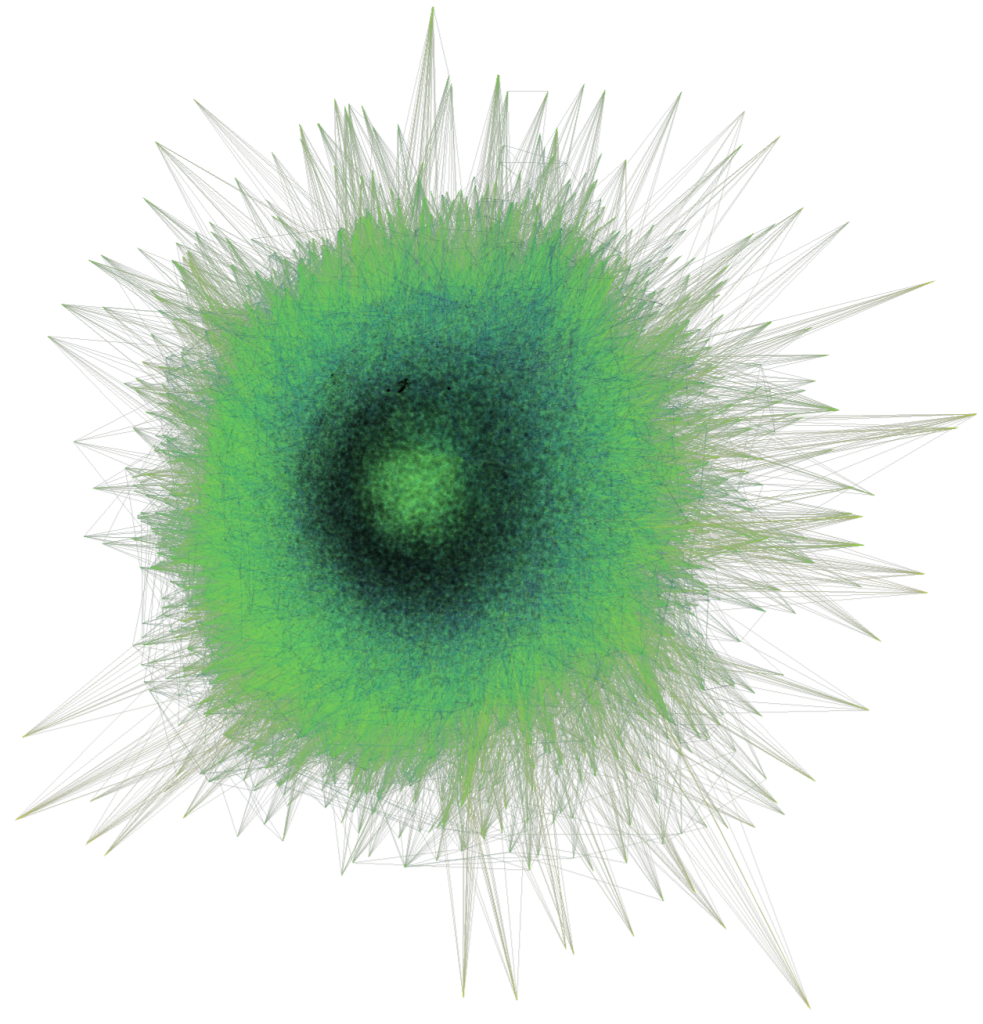
with vertices shown in black, edges colored by length quartile (viridis),
edge alpha = 0.05
with vertices shown in black, edges colored by length quartile (viridis),
edge alpha = 0.2