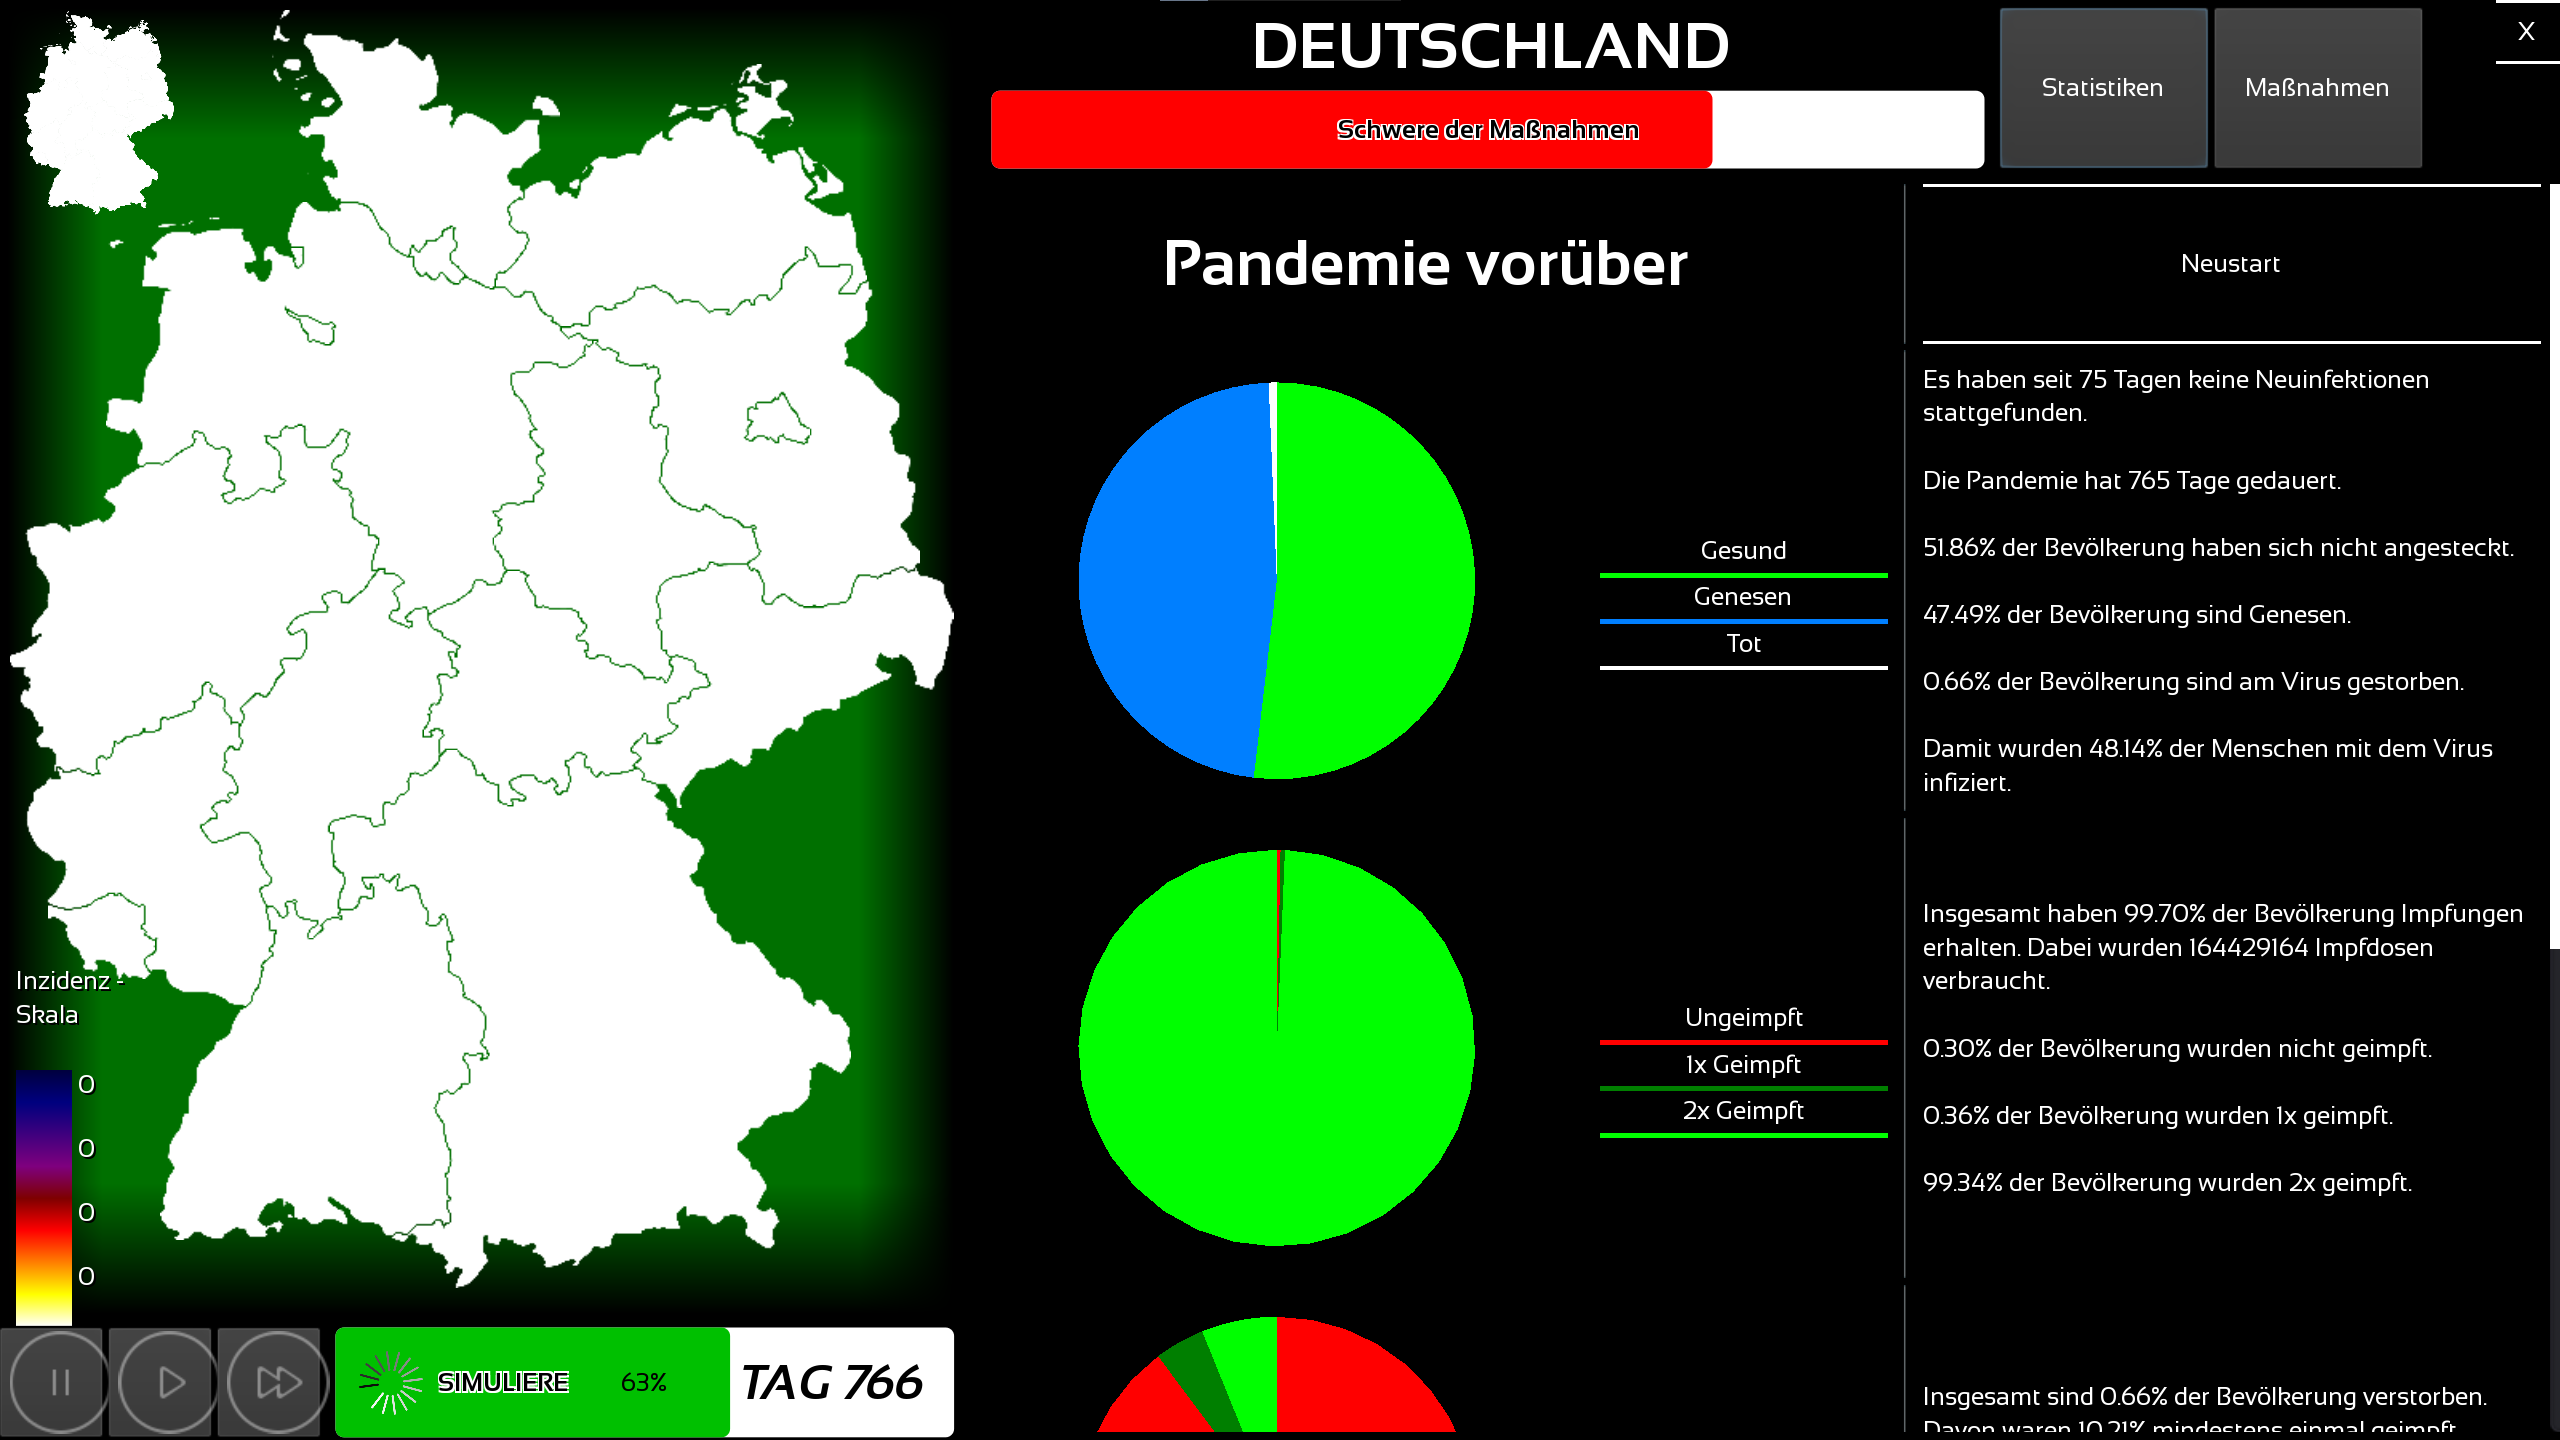
Introduction to the Software
Simulating - Options
- Simulating 7 or 14 days at once
- Pause Simulation
- Toggling Godmode (toggling between full data and measured data through tests)
- Choosing a simulation-factor, that determines how much computing power is needed and correlates with the quality of the simulated data
- Restart Simulation from zero with same random seed
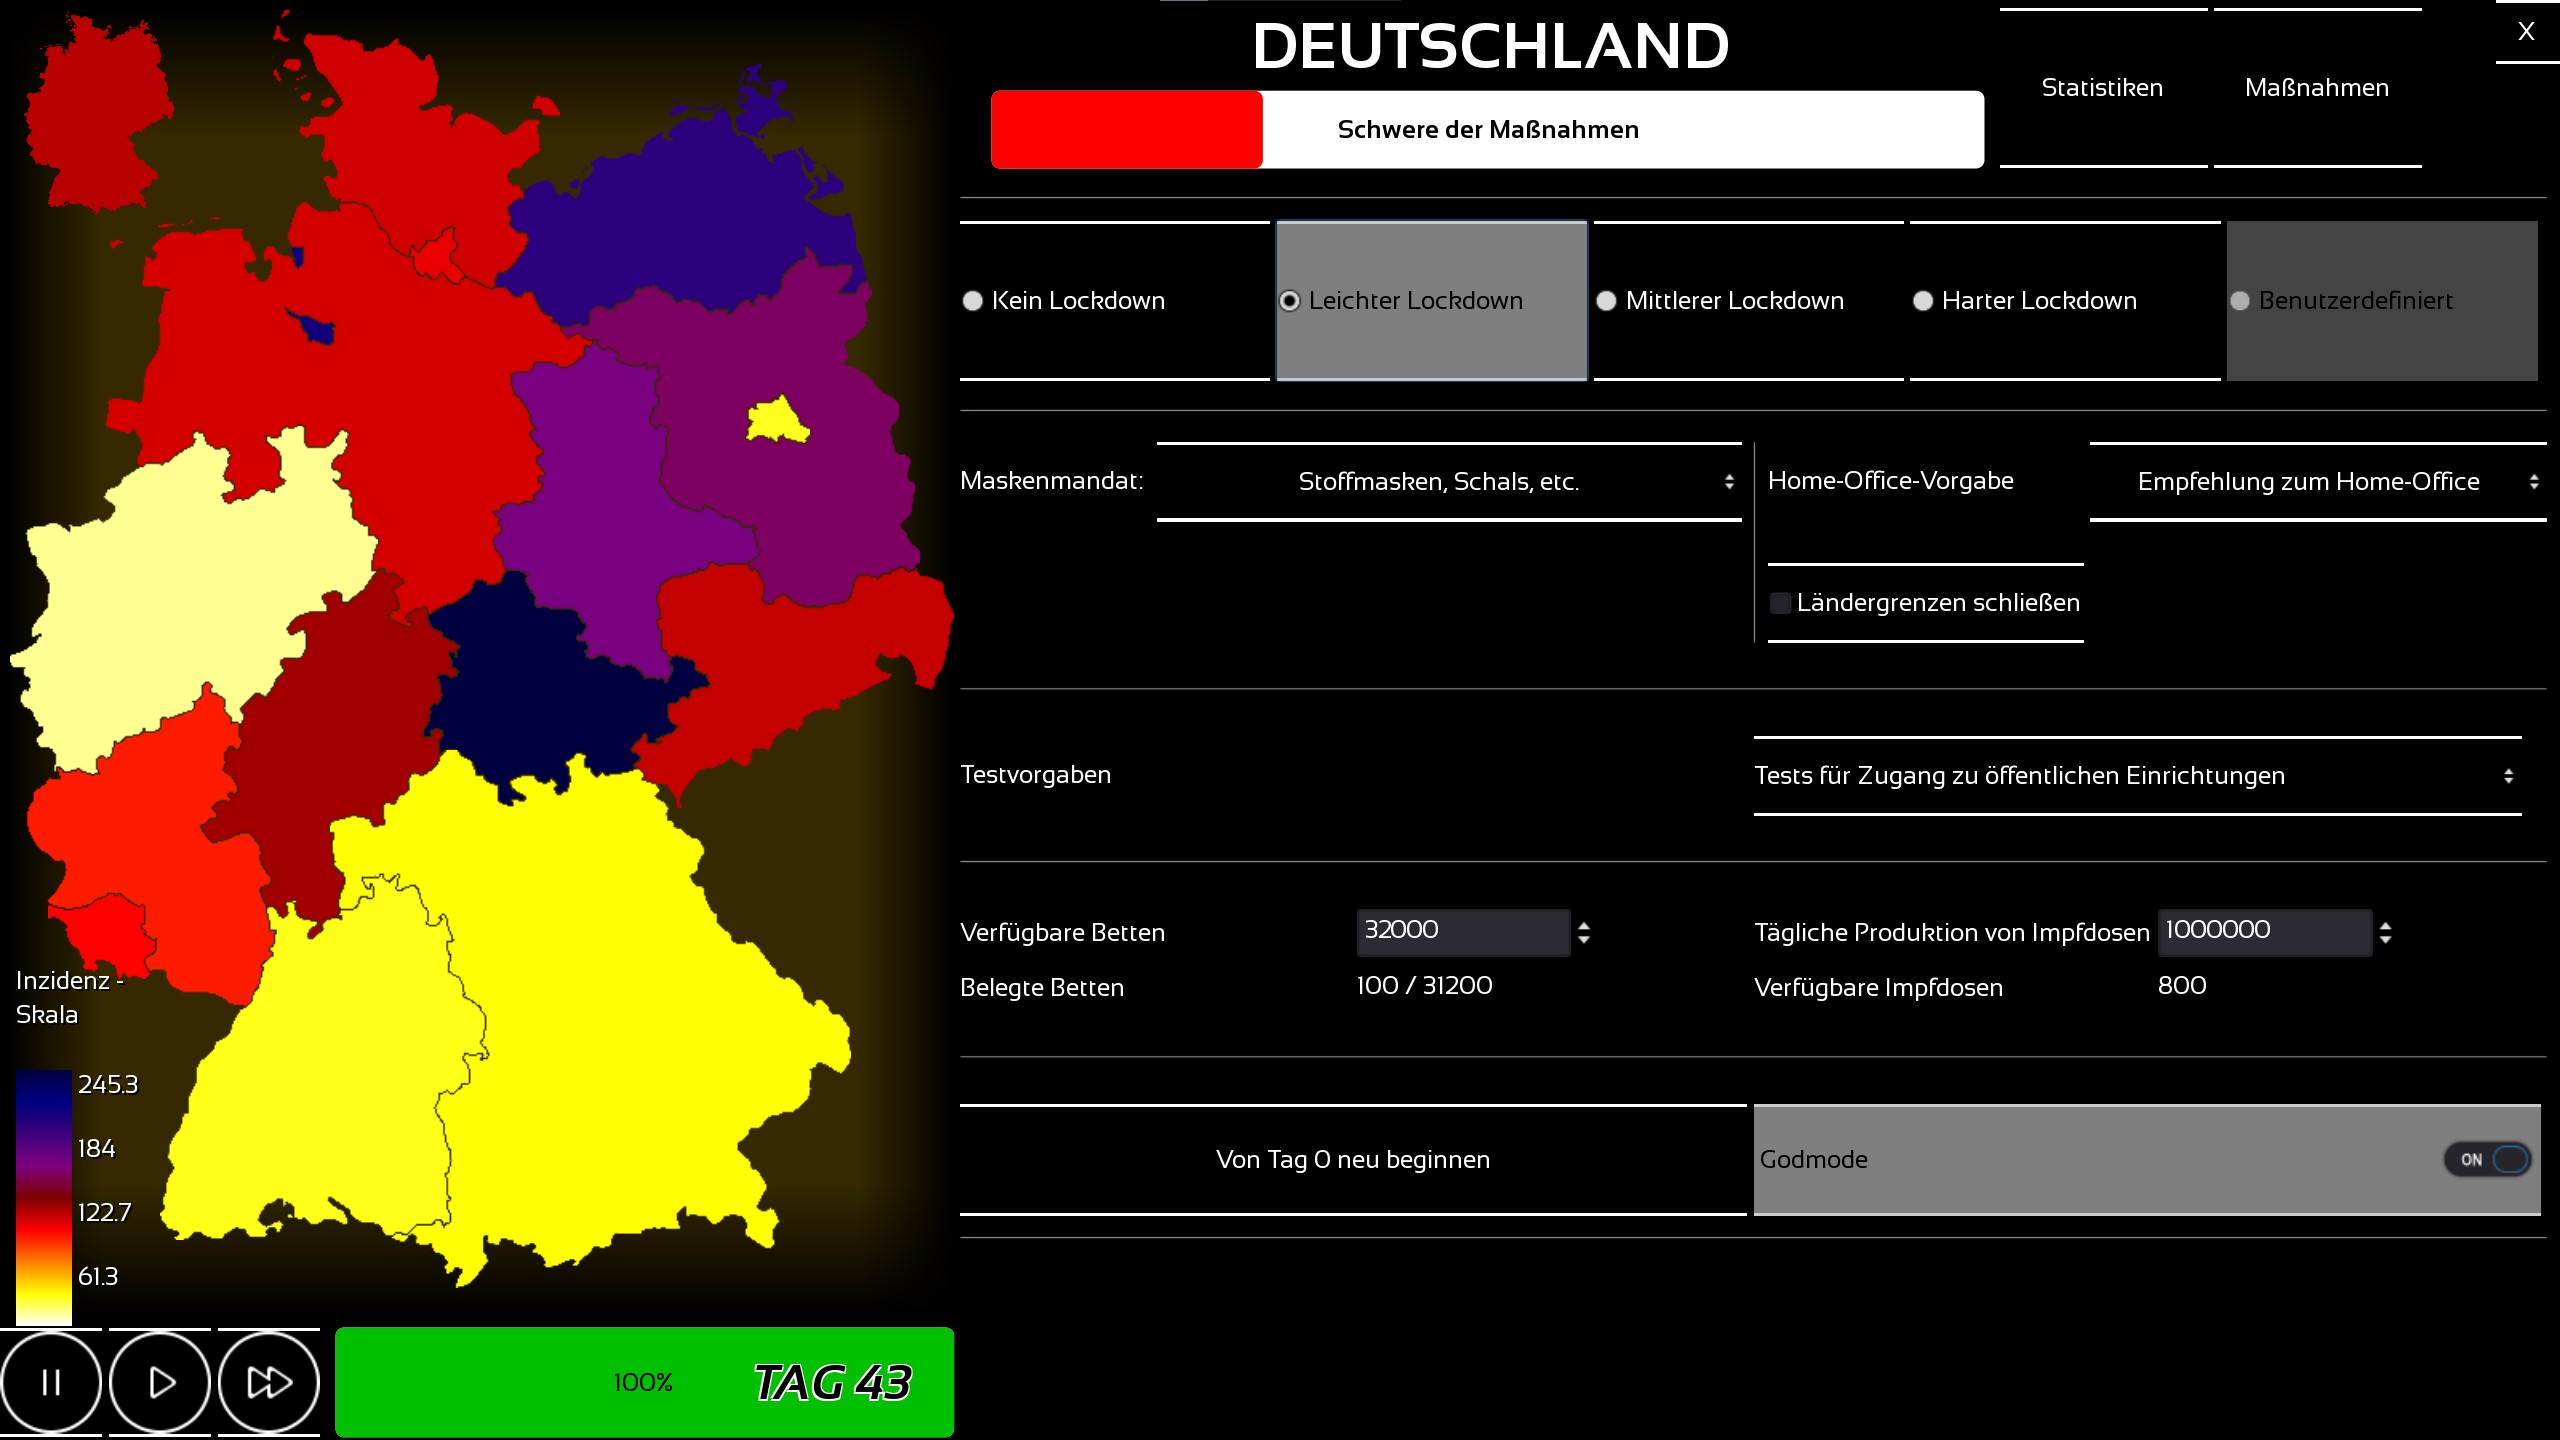
Available measures against the spread of the disease
- Lockdowns with various strictness that include:
- Four Masking options
- Four Remote-Working options
- Closing the borders of a federal state
- Four testing options for unvaccinated people
➔ State-measures can be overwritten by the country
Additional country measures:
- Adjust the number of intensive care beds
- Adjust the daily production of vaccines
Implementing the measures
Infect-Rate and Commuter-Rate
The measures are implemented via the Infect-Rate and Commuter-Rate. Both of these rates get modified with factors that depend on the selected measure. These factors are also derived from papers and real-life data.func simulate():var startTime = OS.get_ticks_msec()events = 0infectRate = [getInfectRate(), getInfectRate()*infectTestFactor, getInfectRate()*infectFactorHosp, getInfectRate()*infectFactorV1, getInfectRate()*infectFactorV2] # untested, tested, hospitalised, 1x-vaxed, 2x-vaxedvar t = timeDifferencewhile t<1:t = gillespieIteration(t)events += 1if(t>1):timeDifference = fmod(t,1)continuewaitDay += 1waitDay = waitDay % Constants.VACDELAY
func getInfectRate():if self.selectedMask != 0 or self.selectedHomeOffice != 0:var lockdownStrictness = (CONSTANTS.LOCKDOWNSTRICTNESS[self.selectedHomeOffice] + (2 * CONSTANTS.MASKFACTORS[self.selectedMask])) / 3.0# print(lockdownStrictness)return baseInfect * (1-lockdownStrictness)else:return baseInfectfunc getCommuteRate():return self.commuterRate * CONSTANTS.COMMUTERFACTORS[self.selectedHomeOffice]
Available Statistics
Basic Overview over the pandemic. The 7-Day Incidence and the 7-Day Reproduction-Value are shown, as well as absolute numbers of infected, tested susceptibles, recovered and deceased are shown. The daily new infections happening, either tested or all cases including unrecorded cases.
 Overview over the vaccination status of the population as well as the daily vaccinations.
 Overview over the vaccination status of hospitalised individuals and the occupancy of the hosptials.
 Overview over the vaccination status of deceased indiviudals.

Overall-Indicator behind map
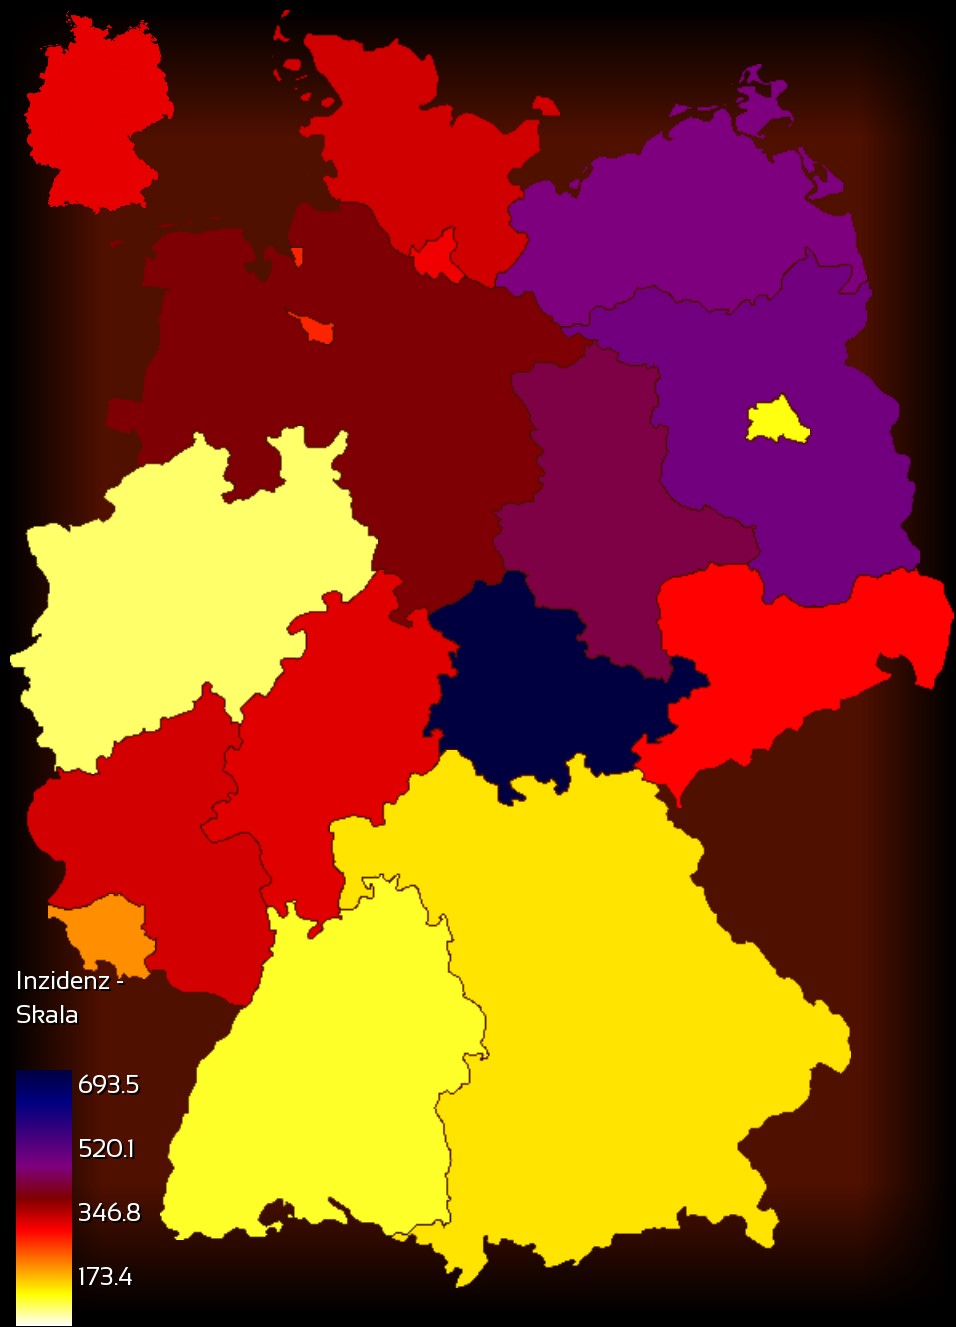
On the map the federal states are colored according to their respective incidence. The state with the highest incidence will always be colored in the darkest color.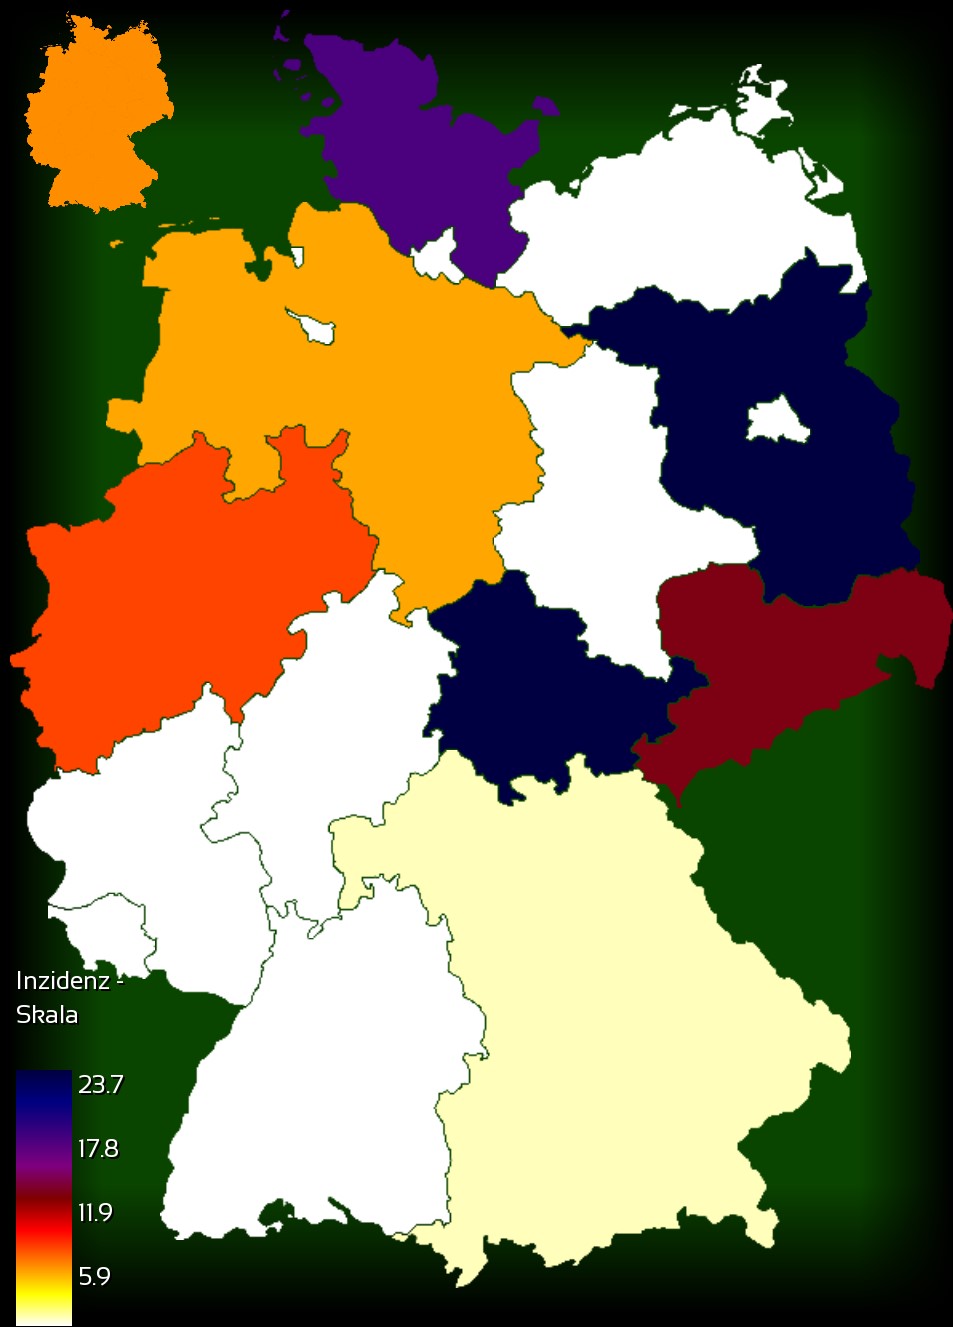
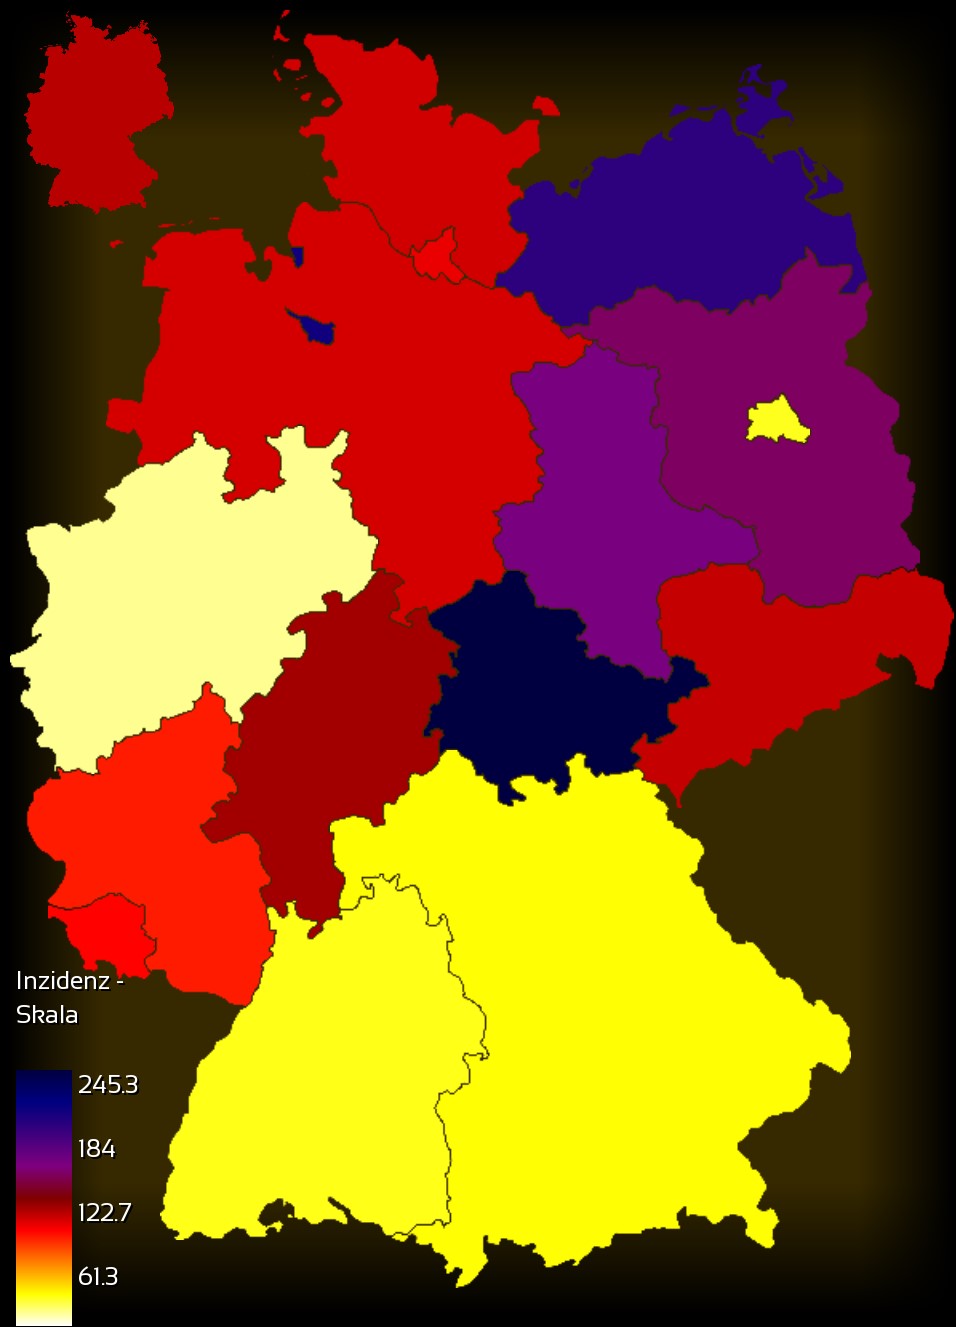
Behind the map there is an overall-indicator to give a feeling on how the pandemic is progressing. It ranges from green to dark red.
End of simulation, Summary of performance
Simulation ends when there are no more new infections inside a certain time interval. When it has ended, there are some stats available to understand the performance of your response management:- Number of days of how long your pandemic has lasted
- How many indiviudals have been infected, recovered, died
- Number of administered vaccines and how many people have been vaccinated
- Number of deaths and their vaccination status
- Day of most active cases and day with the most new infections
- Overall Overview of the cases
