Original capabilities
While Lenia is able to generate patterns in 3 dimensions, the visualization capabilities in 3D are comparably lacking in the native program. The original program draws 3D-visualizations through the usage of flattened depth-maps, with only a few primitive color-maps to choose from. However, when analyzing the life forms, it becomes apparent that they have relatively complex and intricate internal structures, which are mostly omitted by this original approach.
Improved 3D visuals in paraview
The solution to this problem became the topic of my masters thesis, where I explored possible improvements of these visualization capabilities.
Lenia usually renders the computed world in real-time, only depending on the previous set of cell-states and the kernel. This makes it computationally expensive to explore the life forms in high resolution. Certain larger life forms need multiple seconds per frame on a private computer when choosing sufficient resolution. To combat this, I first needed to modify the Lenia code in such a way that I could collect geometric data for every given life form. After implementing the necessary functions, I needed to manually inspect each life form to determine the ideal resolutions for data collection. These were influenced on one hand by the size of the life form and on the other hand by the computational demands still feasible for my computer.
The goal of the thesis was to obtain high quality visualization in Paraview, which is why I needed to transform the geometric data into a fitting format. In the program, the real-time-updating was optimized by working with data in the RLE-format (Run-length-encoding). I wrote simple functions to transform these to numpy arrays first (by reverse engineering the transform Chan used), and to then transform these arrays to .vti files, such that they can be displayed in Paraview.
The first iterations of these files had many issues, which is why a lot of data-preprocessing was necessary before the visualization could take place, especially making sure that the geometry stayed centered on the life form and cleaning erroneous values that probably came from the original program considering the background color as part of the value-distribution.
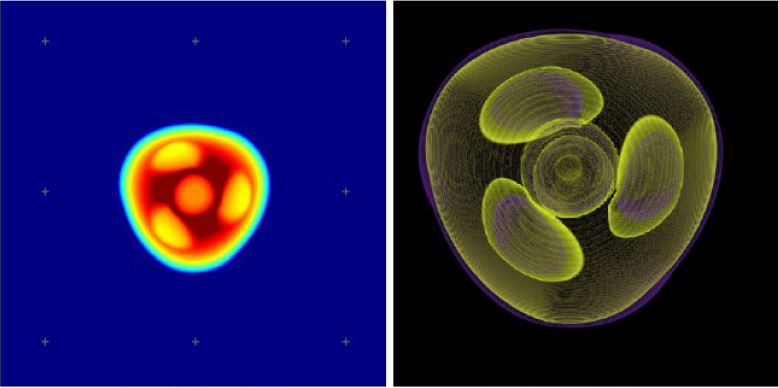
After data preprocessing I studied the distribution of values per life form and manually crafted a few distinct color maps and transfer-functions to highlight value ranges, where the most distinct and prominent features of most life forms arise.
In the end I achieved my original goal and obtained high quality visualization of 3D-Lenia life forms that brought on a significant improvement over the original capabilities, as shown in the sample image above, with the original being on the left and my method being on the right.