Who we are
Dr. Susanne Krömker is the head of the Visualization and Numerical Geometry Group (vNGG) and the supervisor both to Aaron and Mario. She regularly offers practicals for computergraphics and this practical is one of them.
Aaron Pattee is a PhD student for art history at Heidelberg University. He's working with the Visualization and Numerical Geometry Group (vNGG) in order to use computer science - more specifically geo-spatial analyses, 3D models (laserscanning and photogrammetry) and network analysis - for his PhD project CITADEL. CITADEL is an abbreviation for "Computational Investigation of the Topographical and Architectural Design in an Evolving Landscape". Aaron has selected six castles within palatinate (some of them no further apart than 2km) as case studies to investigate how the remaining ruins might have looked throughout the middle ages.
Mario Hinderhofer is a B.Sc. student for applied computer science at Heidelberg University. He has been working with Aaron as part of an advanced practical on his network analysis of historical charters ranging from ~1100-1600 A.D. by creating a graph database in Neo4j.
Assignment
The task was to create a graph database that allows us to see connections and relations throughout the charters that would be hard to see when you just read the charters individually. More practically, the task was to build a network that gives a good overview of six castles (also referred to as case studies), its residents and possessions and the surrounding area throughout the middle ages. The aforementioned castles are all within close proximity (in a radius of less than 10km) in palatinate and are called Königspfalz Lautern, Burg Hohenecken, Burg Beilstein, Burg Wilenstein, Einsiedel and Burg Perlenberg. Their surroundings and everything inbetween them makes up the area of interest.
This graph database is a part of CITADEL, the PhD project of Aaron Pattee (more details below).
The goal of the practical was focused on creating this database in a way that all necessary information is captured while unnecessary information is left out to reduce the workload of extracting the data and to ensure that the resulting database is easy to understand and read into.
Personally, my focus was on the discussion of the structure and on finding an abstract model that captured all the data Aaron wanted to capture but also follows basic rules of graph models such as "A node type that just describes one other node type should be an attribute of the latter". This ensured that the database remained easy to read and only added new nodes if it was necessary in order to capture information. This made writing queries and visually browsing the database a lot easier.
On top of that and because Aaron and I worked closely together on the project, I also helped him with collecting and more importantly rearranging some of the data he collected for the database. We went through many iterations to come up with this model and after the project, Aaron continued to work on it due to feedback on his presentations of his CITADEL project.
CITADEL
CITADEL is the PhD project of Aaron Pattee. CITADEL stands for "Computational Investigation of the Topographical and Architectural Designs in an Evolving Landscape". Besides the geo-spatial analysis of historical maps and architectural analysis using 3D models of the remaining ruins of interest, Aaron wanted to use a network analysis of a graph database. The data comes from charters from 882-1589 A.D. and mention either one of the case studies or a member of the families that have maintained the buildings of the case study. The goal is to obtain additional information on the sites and the families who maintained them to get a clearer picture on their power during the building phases of the respective sites (they have been worked on many times after their initial construction). Hopefully this allows to support or challenge information that was gained through the other analyses. However, looking at the current version of the database we can already see connections that we did not see by just reading the charters as the sheer amount of data makes it virtually impossible to have an oversight without the help of a graphical network.
Example of a charter
The following charter is part of the Regesta Imperii where most of the charters we used are from.
Ludwig II. - RIplus Regg. Pfalzgrafen 1 n. 905
1273 Oktober 11, Heidelberg
Reinhard v. Hoheneck beurkundet, dass er für von dem berzog ihm zugesagte 1000 mark Silber die ihm von weiland könig Richard anvertrauten reichskleinodien dem könig auf dessen ansuchen sofort auszuliefern versprochen habe. Im falle derselbe vorher sterbe, wird er den etwa vom herzog schon empfangenen theil der summe demselben zurückgeben und die ihm gestellten bürgen von ihrer bürgschaft entbinden. Will er aber das geld behalten, so bleibt ihm der herzog für den rest verpflichtet, wofür er dann demselben die reichskleinodien und alles was zu seiner Pflegschaft (procurationem) gehört, namentlich burg und stadt Lautern und die burg Trifels überweisen wird. Riezler, Forschungen 20,237 und W. Acta 1,592 ex or.
(Accessed on 09.07.2018)
 Neo4j
Neo4j
Neo4j is a graph database built in java. Not only are graph databases useful for us because of their higher performance on highly connected data (compared to relational databases) but they also make it very easy to explore the data visually. Neo4j itself offers an interface that gives developers and users an easy-to-use platform to alter and look at the database.
Visual exploration through this interface (rather than writing very specific queries) also allowed us to come upon connections we didn't expect and wouldn't have written queries for. However, it is important to note that this is a very selective view at the collected data.
Further advantages of Neo4j (and graph databases in general) for our purpose are its focus on relations and its flexibility (database model can be edited easily). It also has a query language called Cypher that was heavily inspired by SQL.
Cypher |
SQL |
|---|---|
| MATCH (n:NODE) WHERE … AND … RETURN … |
SELECT col FROM table WHERE … AND … |
Database Model
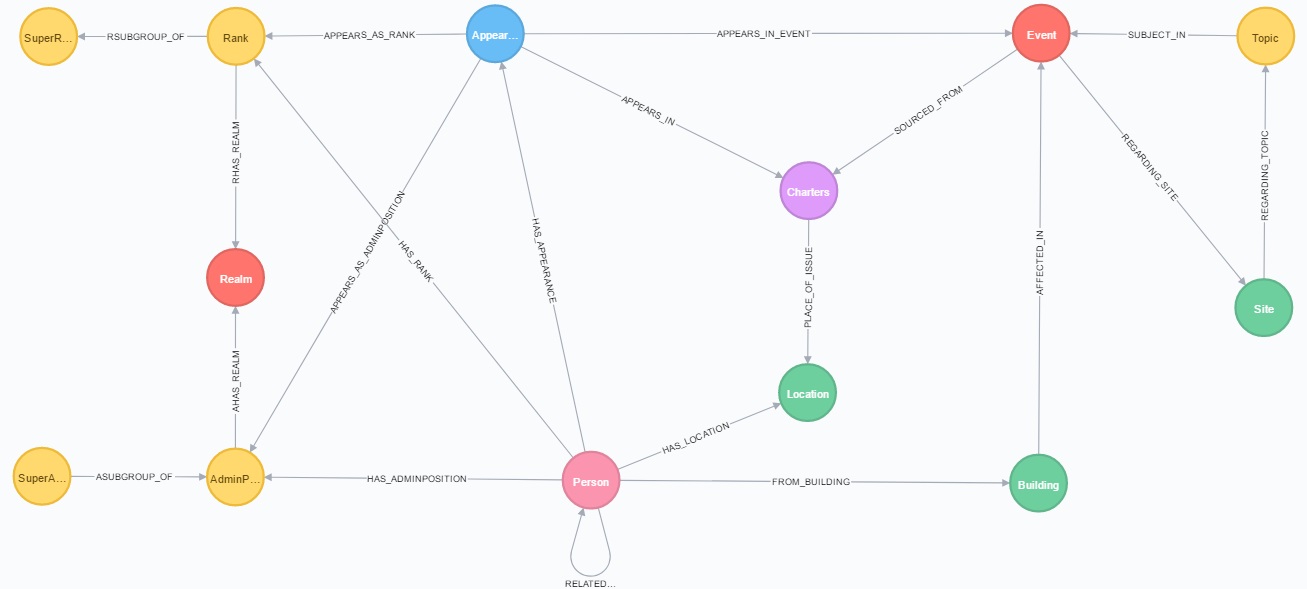
Person | Persons found in the charters. They can be related to other persons, participate in events and have a few attributes such as firstMention (the year of the earliest charter we found them in) |
Charters | Charters are the documents we extracted our data from. We also split them up into events (see below) but they remain in the database to have a better illustration of how the events connect, as a quick way to refer to the source and because not all charters have been seperated into events (see non-focusgroup below). |
Appearance | We added Appearances as a meta node because this allows us to store data of a person specific to a certain event. Most importantly, we can differentiate their Ranks and AdminPosition over time. |
Event | Charters of special interest (see FocusGroup below) are split up into events. We do this because charters often contain several actions. For example, there might be a trade and a confirmation within one charter. |
Topic | Topic tells us what is being discussed. While events have a type (e.g. transaction) and sites refer to specific sites, topic allows for better categorization. For example, two seperate mentions of "fields around Lampertsmühle" in different charters aren't necessarily the same. So instead of having a site of "fields around Lampertsmühle", the site will be "Lampertsmühle" and the topic "fields". This also allows better sorting. |
Site | Sites are points of interest in the charters. A site could be a forest close to an abbey. In many cases, such sites are part of a trade and they can give us an overview of how much land certain groups or family owned in the region in a specific time period. |
Rank / AdminPosition | At the time, ranks and administrative positions were very important. Aaron has designed a sort of hierarchy to have a better understanding of the position in society everyone had. Both ranks and administrative positions can be secular or ecclesiastic. For example, emperor/empress and pope are the highest ranks whereas the highest administrative positions (amongst others) are judges, marshalls and notaries on a state/imperial level. SuperRank and SuperAdminPosition are splitting the ranks and administrative positions into local, state and federal levels. |
Location | any city, castle or other place of issue (of a charter) |
Building | Our six case studies and seven other buildings closeby. They can interact in events the way persons do through appearances. That's because many charters have interactions with buildings rather than persons (e.g. when selling land). |
FocusGroup and Non-FocusGroup
The charters Aaron selected contain over 1400 persons both within our area of interest but also as far away as Turin, Italy. However, our focus lays upon a handful of families that lived in the case studies and the case studies themselves. Collecting the data to create Appearances in Events - including their specific role in it - for all of those persons and possible Events in Charters would cause a work overhead that is out of scope of this project and ultimately doesn't affect our core interests much. That is why we created the "FocusGroup". The FocusGroup is our persons of interest and the "Building" nodes. Whenever someone from our FocusGroup is in a charter, we split it up into events and define their roles. Non-FocusGroup persons on the other side only appear in events if FocusGroup persons are in there as well. Otherwise they are directly linked to charters without any definition of their role.
Structural Choices
In order to focus on the more vital structural parts of the design, let us first talk about ranks, adminposition and realm. These are simply a description of a persons status in society. Since we can only go by what we see in the charters, these aren't always set in stone. In fact, that's why we decided that focus-group persons can have different ranks for each appearance. An example for this would be a man that is first mentioned as a squire and in a later charter appears as knight.
Appearances play a very important role in our database. They allow us to store detailed information about a person. FocusGroup persons have an appearance in an event - a interaction within a charter - that asserts them with a role. This way, we can not just say that a person is for example mentioned in a charter that includes the topics transaction and charity but we can see that he has an appearance in a charity event where his role is giver. An interesting query for this would be "Show all charity events where family members of the Hohenecken family have been a giver and the receiver has been ecclesiastic".
To better illustrate examples like the query above, we also need the concept of buildings. These entities can also have a role in an event which is quite important as many interactions affect an institution like an abbey instead of a person.
Apart from buildings and persons (through appearances) as parttakers in an event, it has some additional information. It is linked to the charter it was extracted from but also has a topic assigned to it and a site. Locations are commonly cities or institutions that persons or charters live or were written in, buildings are institutions within the area of interest that also interact in events but sites are places within our area of interest that can be subject of an event. Most commonly, a site will be traded or given away in an event. Sites can have fuzzy descriptions but they still allow us to better see who owned what at which time.
Advantages of a Graph Database
The goal of the project is not just the systematic digitalisation but to use computer science as a tool to better understand the available data (here: the charters). That's why graph databases are a huge advantage for us: We can go into the database, look at specific data and easily (and quickly) see its relations and even go and explore. In a relational database, we would have to write new queries to reach additional data. This is especially handy for the user who will most likely not have a background in computer science.
Below you can see an example of the visualisation within Neo4j:

Blue: Person, Green: Location, Light Red: AdminPosition, Red: Event, Purple: Charter, Grey: Appearance
By clicking through the database starting with Eberhard, we found out that in his location/home one charter with 2 events has been signed and one of those events includes Stephan who has the same location and rank as Eberhard.
Of how much use is this database model for other (similar) research?
When it comes to storing and analysing the data within charters, I think we have created a good basis to work with. Working with other charters might not need any significant adjustments. If said charters are within another region, you can simply put in your own FocusGroup, buildings and sites. A limiting factor would probably be the ranks and adminpositions that Aaron categorized, as these have a specific meaning in this area at this time and might mean something different at different times and in different places. Topics and many attributes for persons, charters and events however are very common terms that could be reused, possibly with some additions depending on the research interest and content of the charters. Overall I think that this concept can definitely be adjusted and used for similar research.
Here you can find the slides of my presentation on the project.