VIRUSEPIDEMIC
Visualising the Epidemic
Visual Feedback
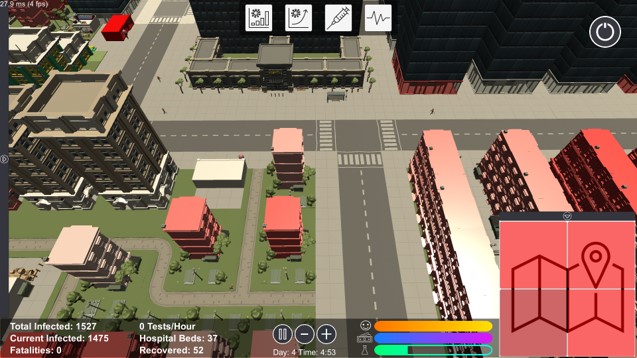
Visual feedback on the state of the epidemic is crucial to the user experience. Some feedback is already implicit. For instance, with many people in quarantine, the streets look a lot emptier. Other feedback had to be made explicit. For instance, the proportion of infected among the people present in a building is visualized by coloring the building in a respective red tone. The module quick-select buttons in the bottom right of the screen also give a visual overview over where the epidemic is most present in the city. For more detailed information, the player can observe real-time graphs and statistics.
Before:
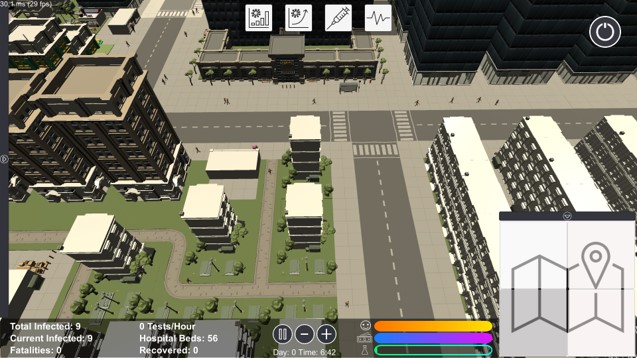
After: