After our last project , we wanted to work on something different.
So we came up with the idea of a simulation of the Neuenheim Campus. We then discovered that the city had multiple plans to alter the layout of
the public transport stations in Neuenheim. But these plans did not come to fruition as of yet. Our simulation might be a tool to determine whether
a new station might be useful and how great of an effect its introduction would have on the traffic.
Another result our simulation delivers is that it calculates the optimal paths pedestrians should take. The resulting graph could then be compared
to the existing path network and help to plan new paths and make them more efficient.
But as we are only two students and we had a limited time frame to complete the project, it comes with three major limitations. The first one is
that our simulation can only simulate one specific day, a Wednesday, in the summer term of 2019. We decided on that because of the sheer amount of
research that had gotten into just this one day. The university does not provide the proper tools to extract the necessary timetables, and we had
to do it all manually. Besides, the summer term of 2019 is long before covid and therefore allows for an undisturbed picture of campus life.
But more on the data, we used below in the subsection DATA.
The second limitation is that we had to make educated guesses about how many students were present on the campus. We calculated that roundabout
one-third of all students in Heidelberg visited the Neuenheim Campus on that particular day. But more on that in the subsection DATA.
The last limitation is that our students do not form social connections and groups. Every student thinks only for himself and does not interact with others.
Therefore there is no group interaction, and this affects the outcome of the simulation heavily. More on that in the subsection CODE.
But even with these limitations, the simulation results are useful and realistic as long as nobody has any social contact.
Furthermore, the simulation provides a groundwork that one could build upon.
Before we constructed the campus l, we built a naive prototype, with default Unity methods, to test our idea and get the first performance readings. The first iteration of our prototype was just two buildings and 500 agents (the red dots) constantly commuting between them. Here we encountered the first problem with our approach. As you can see below, the agents gather in large crowds in front of the entrances. These chokepoints play a vital role in the performance of our program because each agent has an internal collider that constantly checks its surroundings and is trying not to clip into other agents.
The first solution to this problem that came to our minds was that we expand our prototype to include more buildings with more entrances. Because even on particularly busy days, there are not over 100 students trying to enter a building at once. But even with the expansion, the congestion, and therefore the performance problems, continued. We averaged around 40 fps with 2000 agents, but we estimated that the finished simulation would have to simulate at least 5000 agents at peak times. As an easy fix for this problem, we deactivated the colliders.
That fixed the gatherings, as you can see above, but the fps were still not acceptable. While testing our new approach, we encountered the second problem with our implementation. As we increased the number of agents, the time to calculate each path increased as well. The cause of that problem was that each agent calculated its route because we were using the default Unity methods. In the section CODE, we talk about how we solved the problem.
After our prototype test runs, we had a basic understanding of how our simulation should work. But as we were going to simulate the real campus, we were first going to need a l of it. This process is described in the first section. In the second section, we explain the research that went into the timetables, because our simulation creates individual ones for each student that he then uses to navigate the campus.
If possible, we wanted to avoid building the model by hand because it would be a lot of work, and additionally, it would just not be part of our topic if we
had to focus that much on this part. We tried different services and projects to get the best fitting data (and still get advertisement emails from everywhere),
and the best compromise between good fitting data and easy accessibility was to use Houdini.
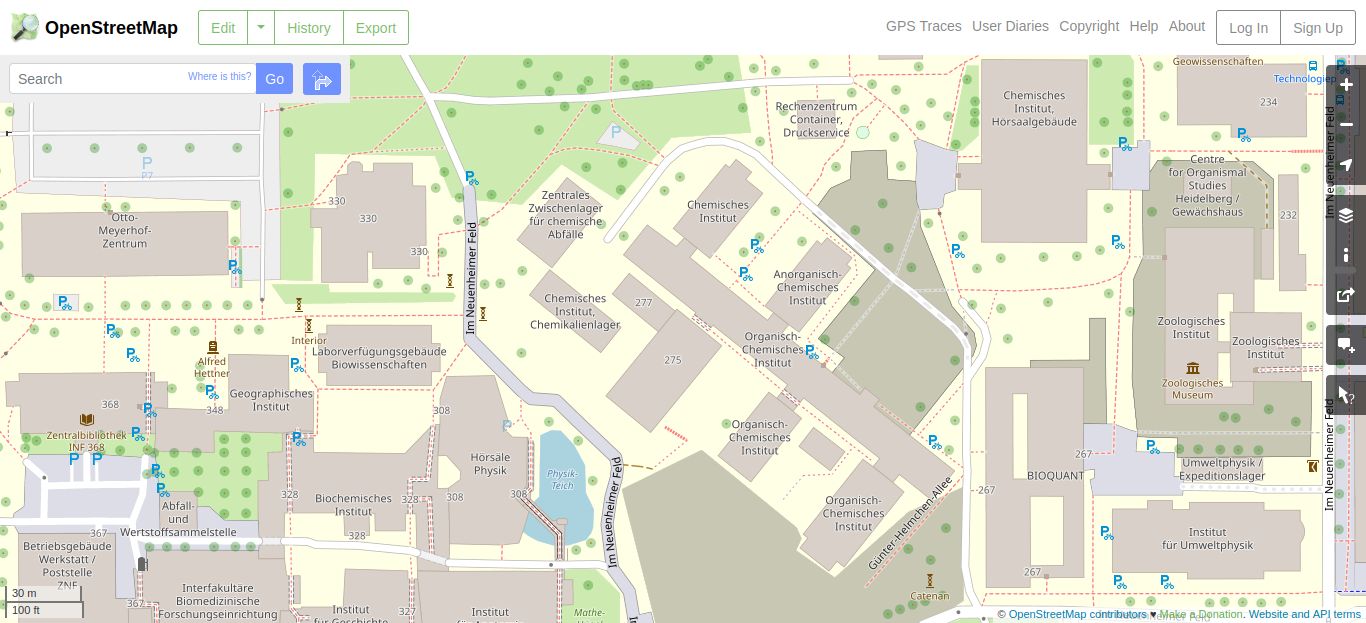
At first, we ought to acquire the data from OpenStreetMaps. It is a free source for map data because it provides streets, small paths, and even pavements.
In addition, it also provides the 2D layout of most of the buildings, which was what we needed for our model. Furthermore, one can mark and export parts
of the map to download it.
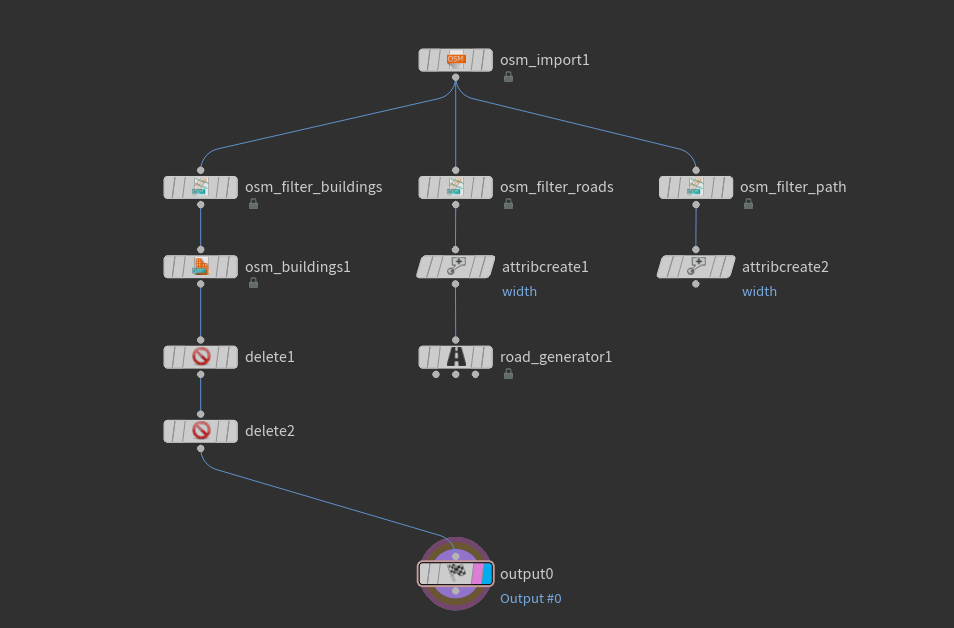
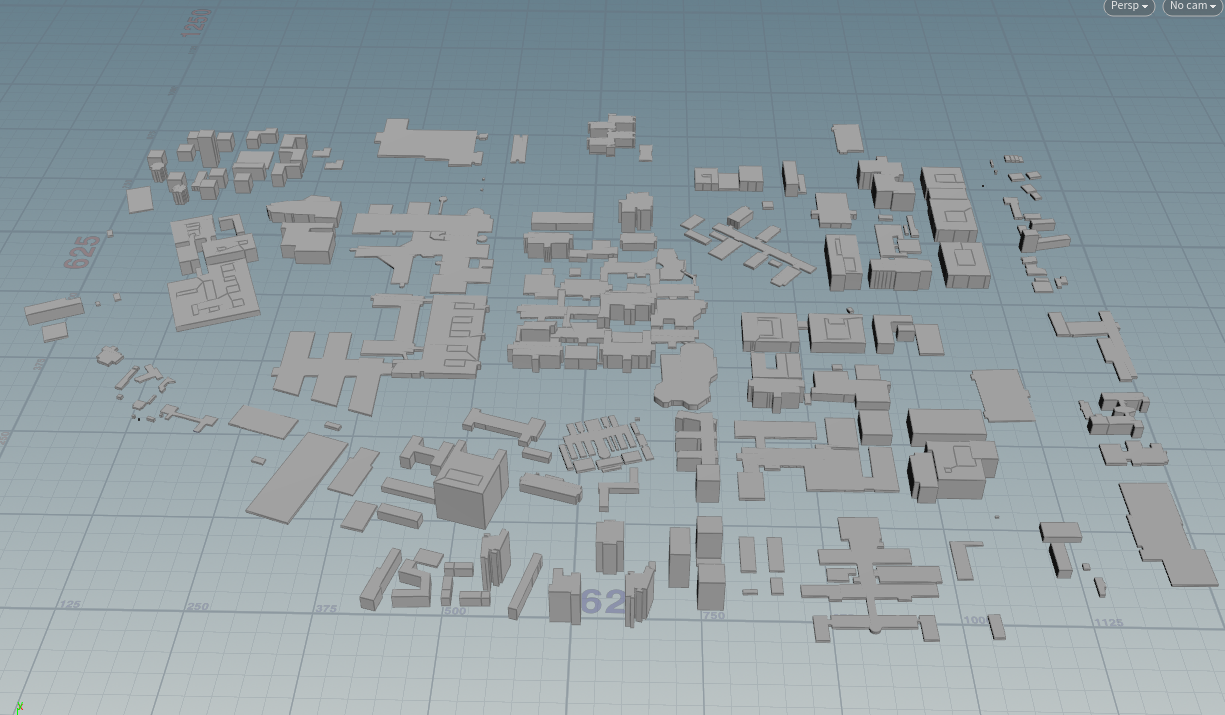
For the next step, we imported the .osm file to Houdini and edited it enough to make it usable in Unity. To achieve that, we created a workflow, which at first separates the buildings from all the other data, it will come again later in the RESULT section. After the buildings are separated, they get 3D-generated from their ground plan. For some buildings like the Mathematikon, the height data is available. For less important ones, the height data is random. In the last step, the mesh gets saved as a .obj file, which is just a bunch of points from which many programs such as Unity can build and render 3D objects. For the next step we imported the .osm file to Houdini and edit it far enough to make it usable in Unity. To achive this we created a workflow, which at first seperates the buildings from all the other data, these will come again later in the section. After the buildings are seperated, they get 3D-generated form thieir ground plan and a height, which is given for some important buildings like the Mathematikon, and for the others random from a given range. In the last step it gets saved as an .obj file, which is just a bunch of points from which many programs as Unity can build and render 3D objects.
The first step was to get the number of seats in each lecture hall and seminar room. Luckily the university has a "Hörsäle & Seminarräume"-website. But this list only contains 49 rooms for the Neuenheimer Feld, which are far too few. Another source for information about the facilities in the university is the LSF. In the subsection "Facilities", we found a completer list. The LSF list also contained the lectures and at which time they were held. The problem was that the navigation was tedious, and it took a while to collect all necessary information. All collected information was then written in a spreadsheet.
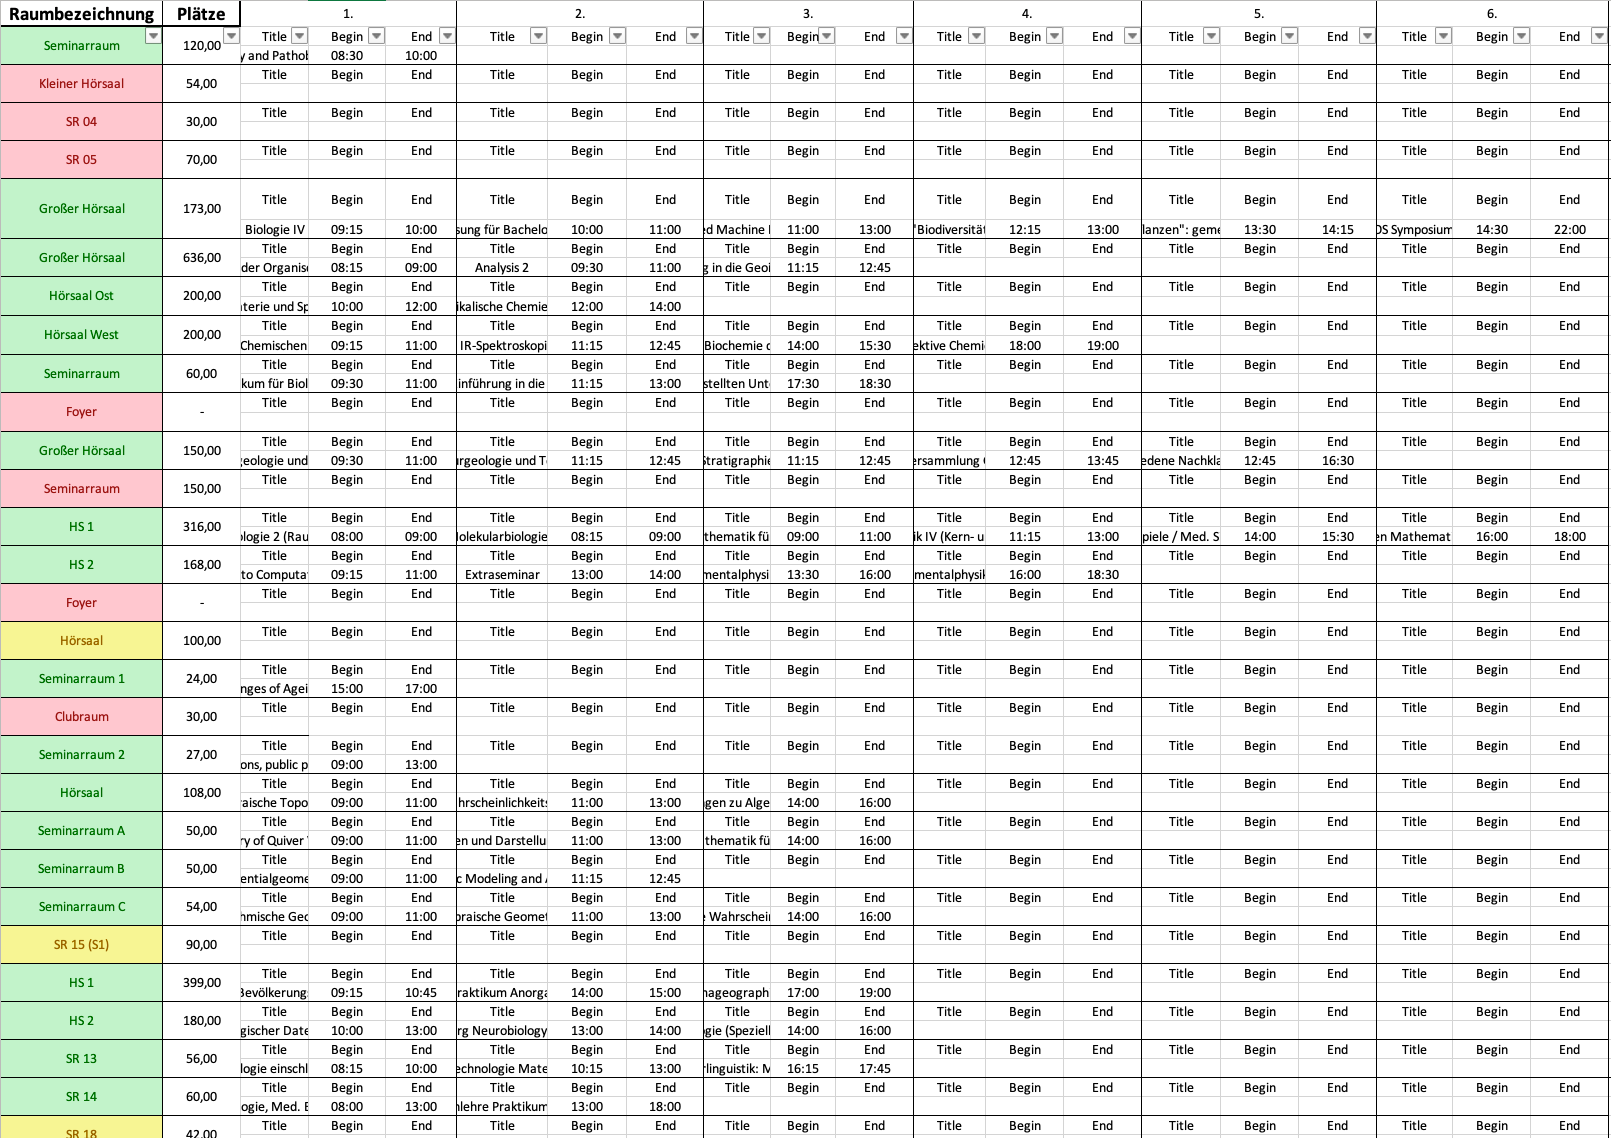
As you can see on the right, the spreadsheet contains the name of the rooms as well as the number of seats and the title and time at which a lecture took place.
The green-colored markings on the left indicate if a room with the number of seats was found and a lecture took place in it. The yellow ones indicate that there
were no lectures that day, and the red ones indicate that either the LFS or the
"Hörsäle & Seminarräume"-website was missing information. For instance, a lecture
hall was mentioned on the "Hörsäle & Seminarräume"-website
but could not be found in the LSF and vise versa.
In the end, we found 72 lecture halls and seminar rooms with both the number of seats and lectures that took place in them. That information was then saved as a JSON for later use.
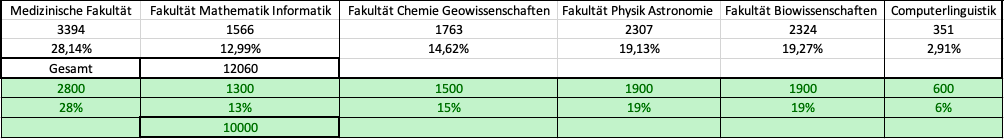
The last data we needed was the number of students that visited the lectures. In our research, we found the "Studierendenstatistik der Universität Heidelberg", which contained the number of students per faculty. The information contained within you can see below. We decided that we calculate the numbers per faculty for 10000 students because not everyone visits the campus every day, and apart from that it was far easier to work with that number.
After all these preparations, it was finally time to implement this into a functioning simulation. Though there were some Unity-intern features to help, they needed some tweaking or workarounds to fit our needs. These will be explained step by step in the following.
Before we could even think about people running around, we had to construct a plan that everybody knew where they should have to go. We already had the JSON file with all the
lectures, including start time, end time, faculty, and the number of available seats.
The first thing that needs to happen is that all students must search for lectures on their schedule out of the list and add them to their timetable.
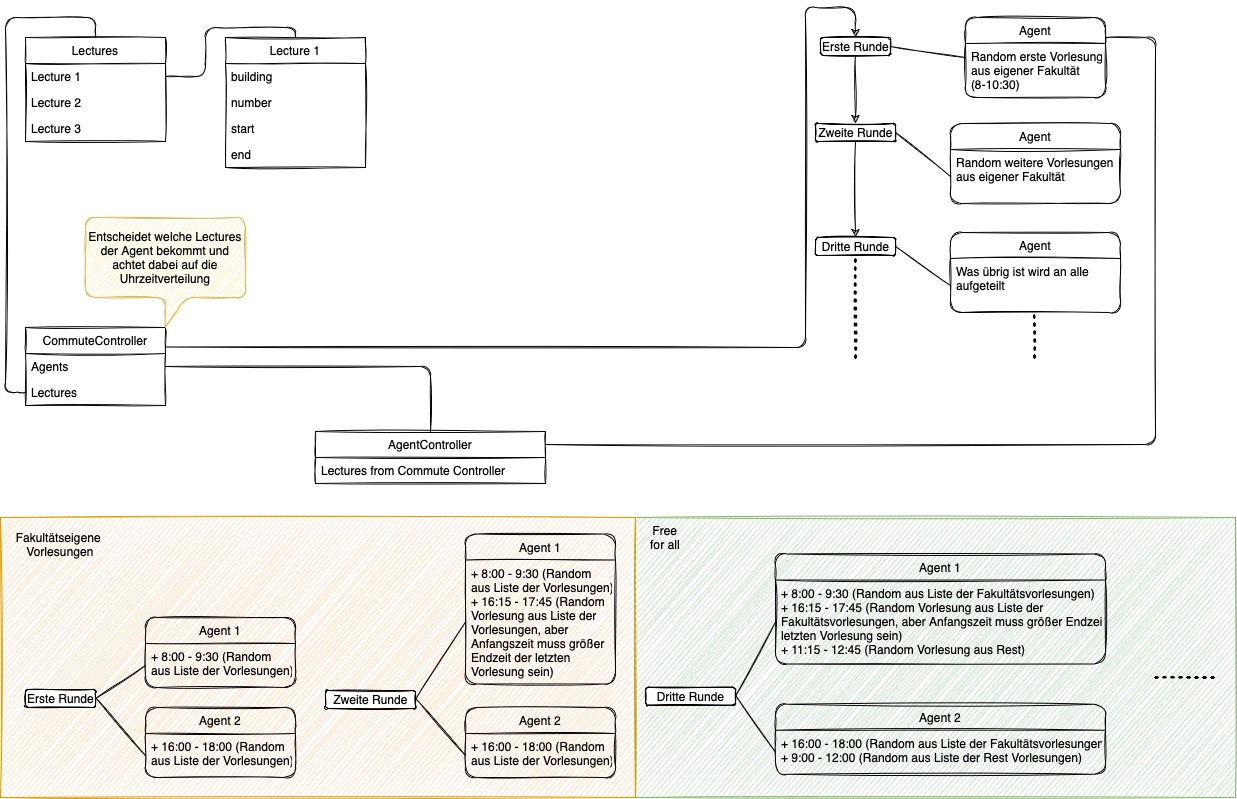
To make a more realistic assignation, we decided to make a round-based procedure with different rules in each round. But every iteration has one fundamental regulation:
A student can get not more than one lecture. A round is complete when every student has had the chance to pick a class.
In the first round, the student has to select a lecture from his faculty. That makes sense because if, for example, someone is studying biology, he probably has to attend a biology lecture.
In the second round, the first rule still applies. But in addition to it, a new lecture is not allowed to interfere with an already existing one. It also adds a buffering
time of 15 minutes to the beginning and end of each lesson, as students need time to walk from one building to the next. In the third round, the rule changes completely by
allowing any lecture to fit into the timetable. It might seem odd at first, but almost every course of studies needs some lectures from other faculties in the course plan.
Until all students have at least one lecture the loop continues like that. Unless the number of empty seats does not change from one round to the next, in that case, there
are no available lectures left that would fit in a timetable.
Finally, there should also be a lunch break, preferably at lunchtime. In this last round, every student's
timetable is searched for a break between 11:00 and 14:00, which is long enough to go to the mensa building, eat something and go to the next lecture. There can be no
time for lunch if the lectures take place at lunchtime.
The NavMesh is an internal Unity feature that creates a grid over the map. With it, it is possible
to navigate around buildings and streets. It is generated once in the editor and saved as a file.
Its API also provides useful properties, such as calculating a path from one point to another through the mesh or checking if a point is still on the mesh.
It is also possible to cut holes in it, making areas inaccessible, which will also come in handy later.
The NavMeshAgent is also provided by Unity and is a controller to move objects along a NavMesh.
It is, for example, possible to give an agent a target on the NavMesh, and he calculates the fastest route to reach it. We used this functionality to calculate our paths.
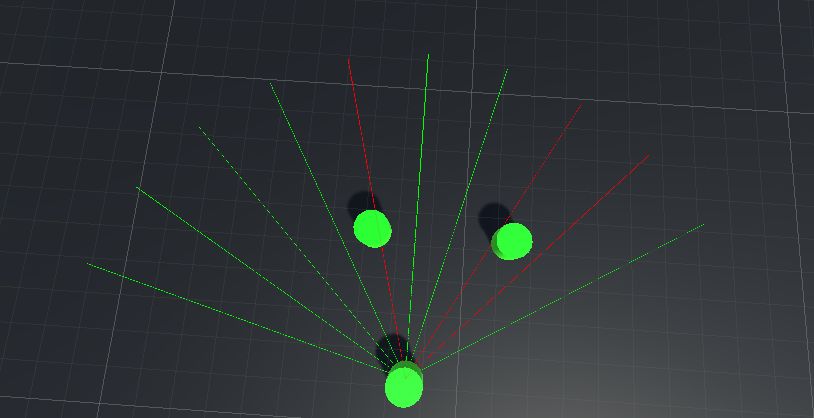
Unfortunately, not everything inside this navigation system is accessible to the user. For example, you cannot give the agent a self-made path of points to follow. That was
a problem for us because we had to make changes to the calculated paths. We, therefore, created our version of the agent, which you can see in the picture. To give them a
more human-like behavior, we added the ability to avoid each other at a defined distance. These calculations came with a hefty performance loss, which is why we made them
optional. If the user has a powerful enough PC, he can turn it on in the settings menu.
To visualize the paths, we finally added a LineRenderer, which draws a line for each path.
This way, we can compare the walked paths with the actual ones. For more information on the results, see the RESULTS section.
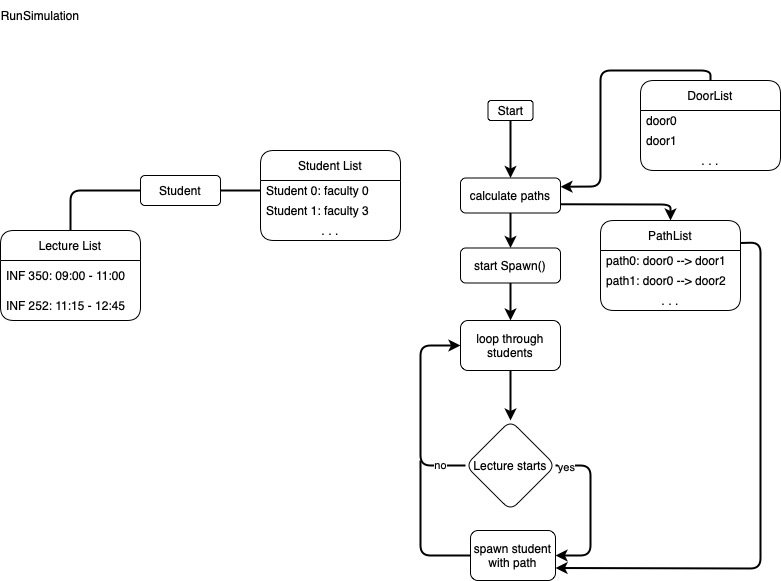
Now we had laid all the groundwork to start the simulation. For this, we designed a simulation routine. It requires the student list from the initialization mentioned above and a
list of doors, which are found by searching for all objects that have "door" in their name.
In the first step, all paths are getting precalculated. This means every door gets connected with every other door. We do this because, as mentioned in the NavMeshAgent,
each agent can calculate his path to a given target, but doing this while running the simulation leads to heavy delays to the point where hundreds of agents are blocked at
the entries to the campus trying to calculate their ways.
As soon as all paths are calculated, the simulation starts, and the in-game clock begins to run. With this, the
simulation routine starts checking every student on the student list every three seconds if somebody needs to go somewhere. We first tried to display each student as a 3D object,
but the performance was too low, in our opinion. So whenever a student needs to go somewhere, an agent gets spawned with the target of the student, "carries" the student to his
destination, and gets deleted afterward. This next destination is always held ready by every student, so there is no need to check the whole timetable every time the routine comes
across.
This way, the simulation gets managed as efficiently as possible. But regardless, some frame drops at peak times, such as the lunch break, remain. To mitigate the effect
these drops would have we linked the clock speed to the performance.
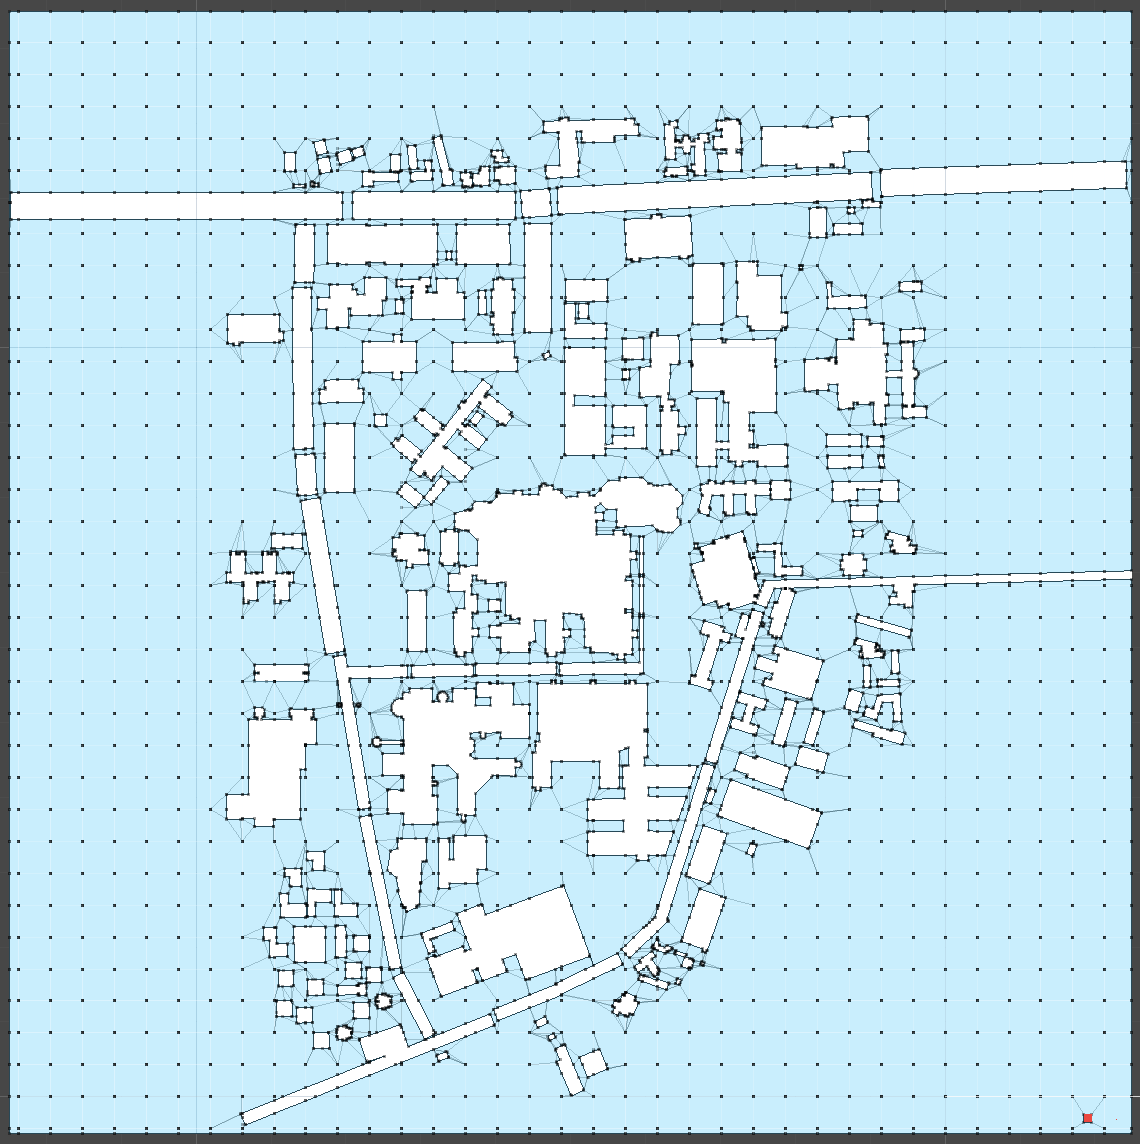
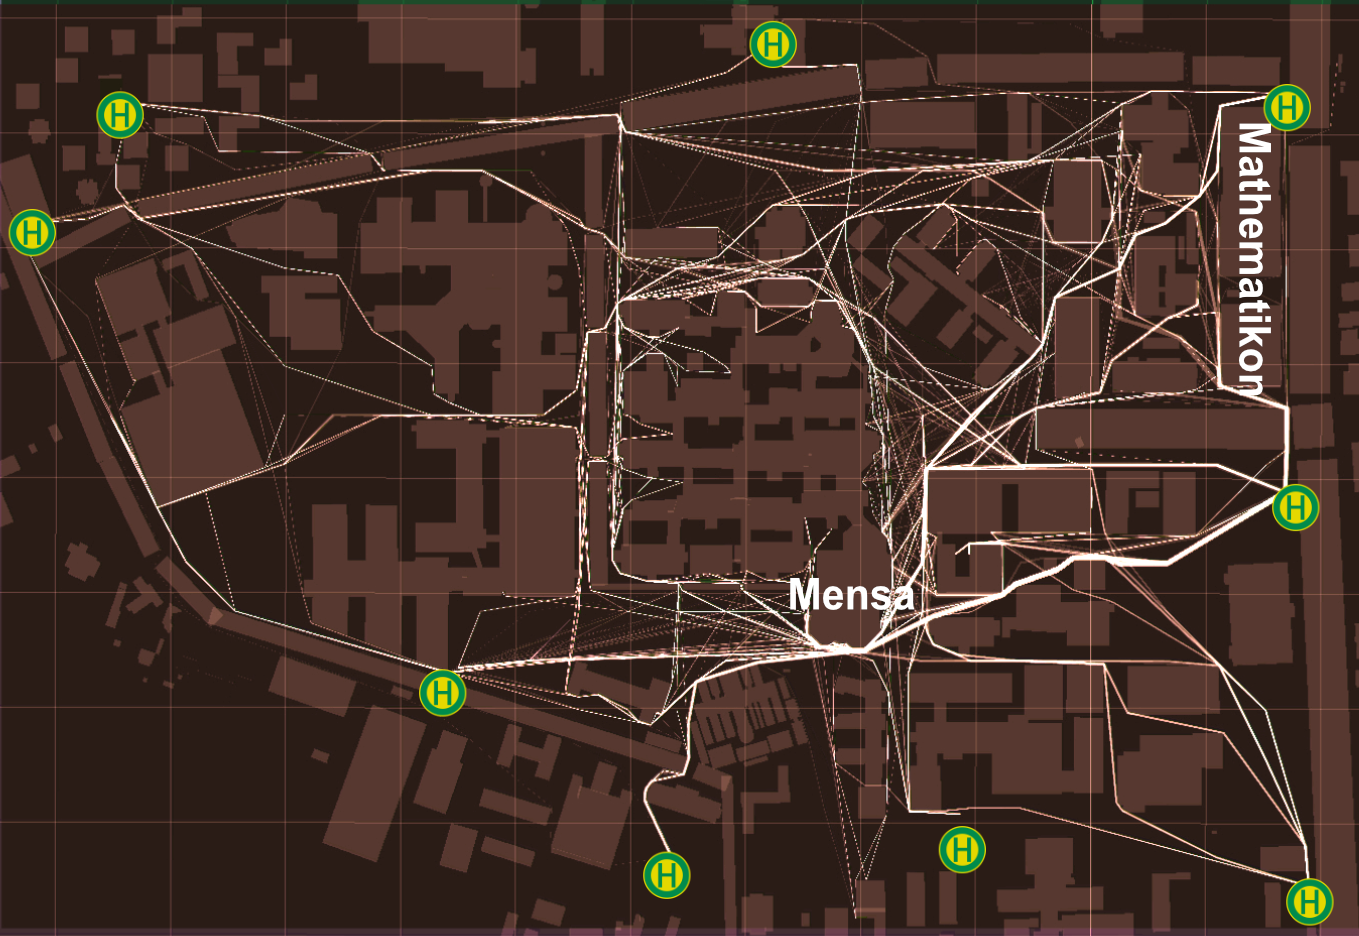
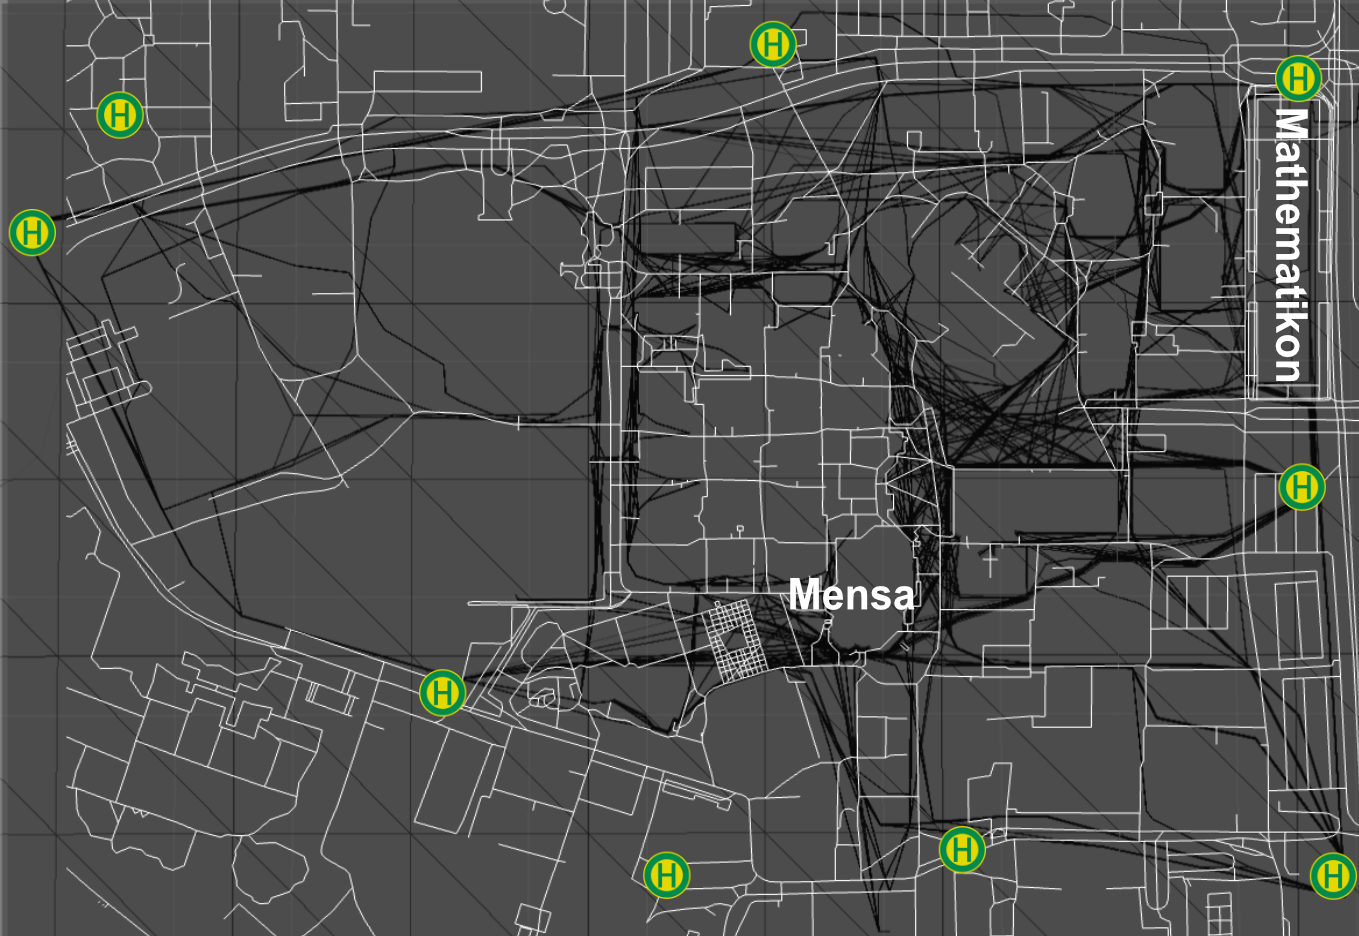
To test the capabilities of our project, we came up with some made-up but reality-orientated scenarios, which can be seen below. For comparable results, we ran every scenario three
times and used an image editor to overlay the results. We also added icons for the entry points and labeling for the Mensa and the Mathematikon.
Depending on the scenario, we had
two different map types, one for better visualization of the path themselves in black and one in orange for visualization of the usage of the paths.
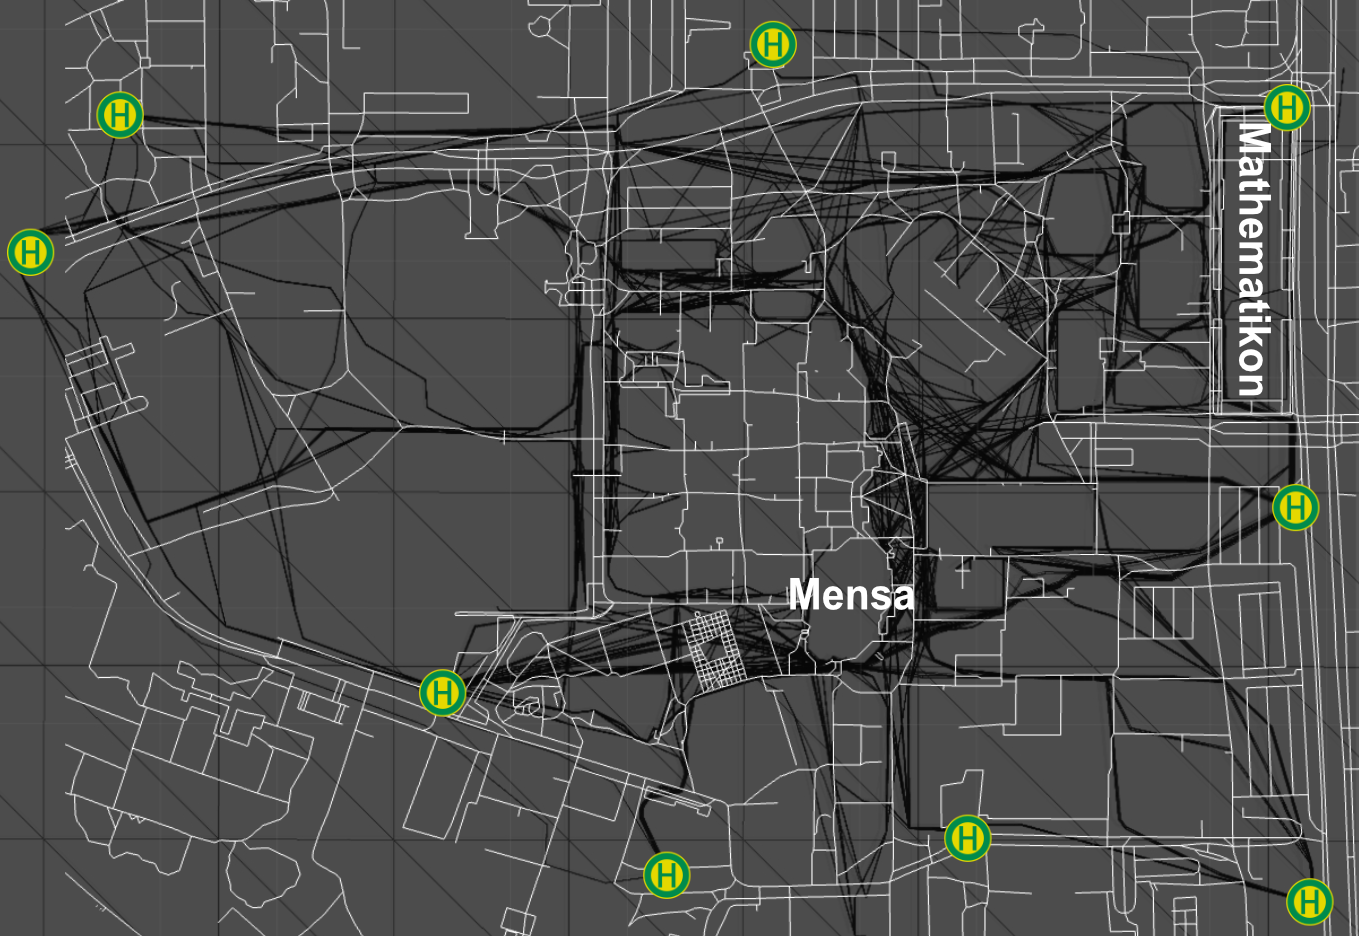
The first experiment shows the differences when the number of students is 7000, 4000, and 1000. Many paths are still in use, with fewer agents walking on them. So far, that was the result we anticipated.
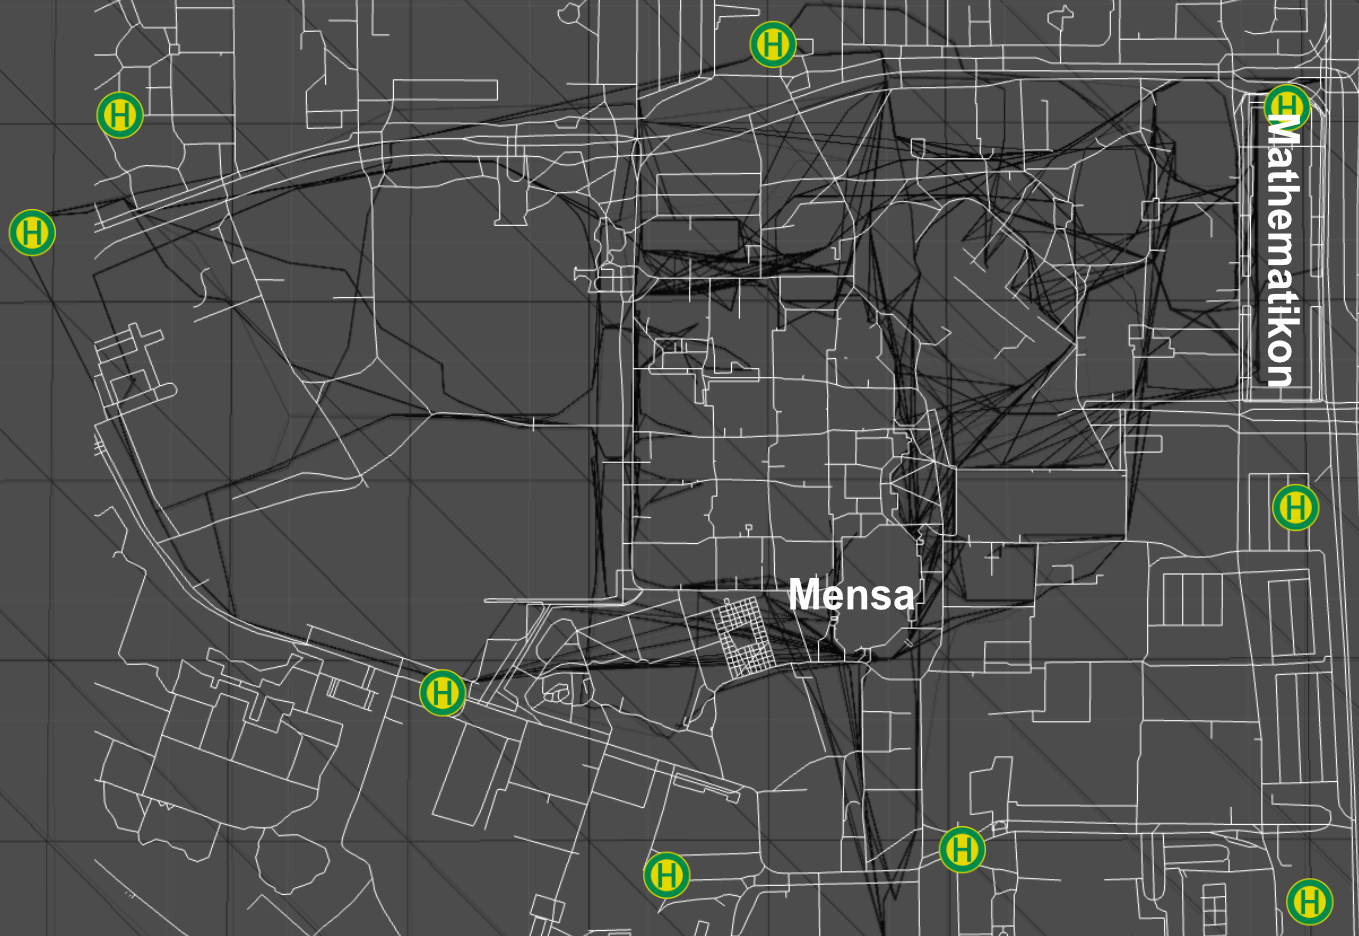
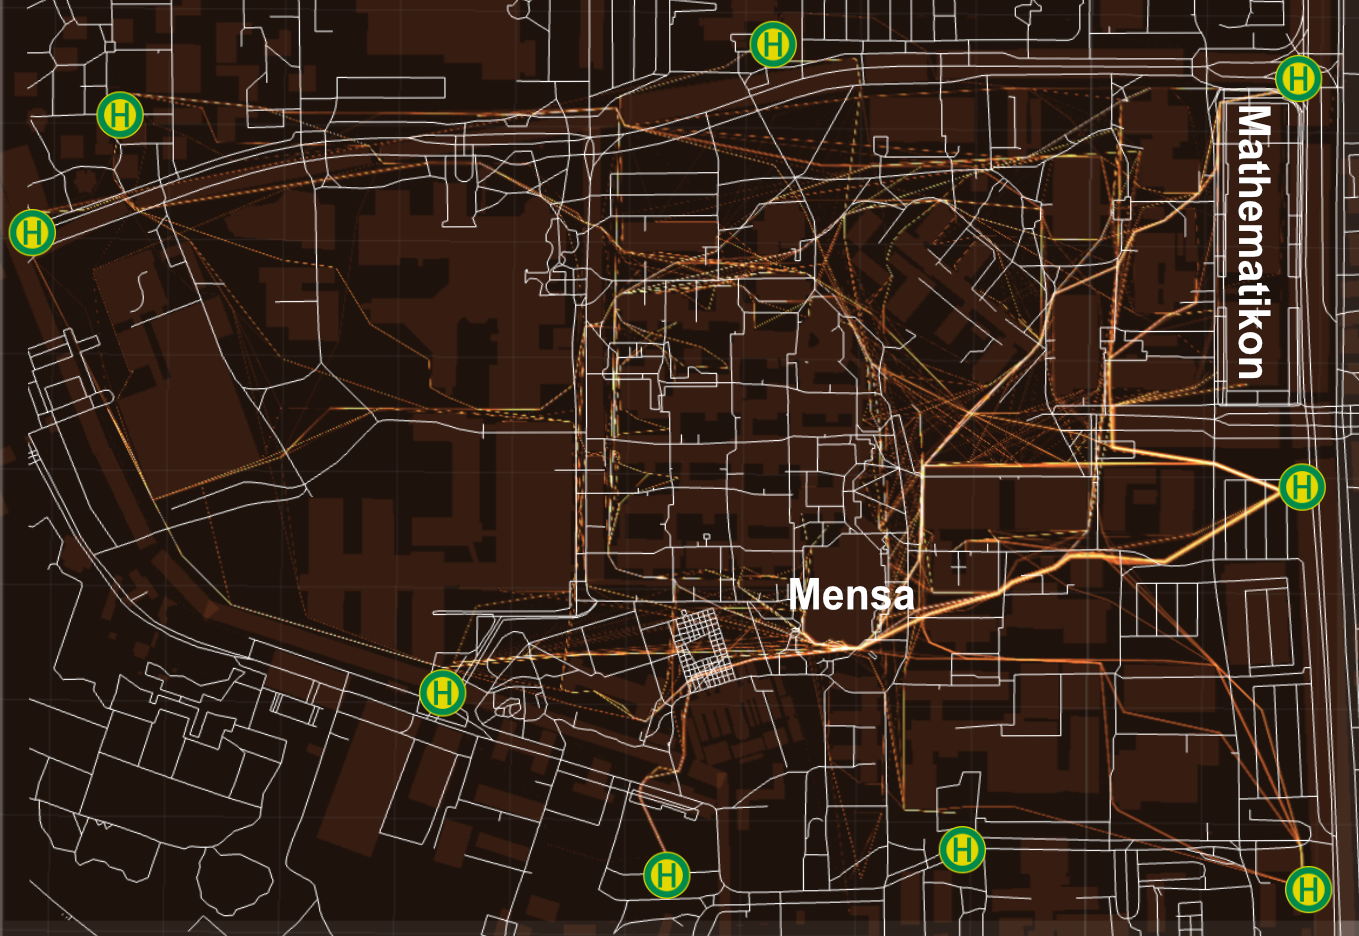
In the next simulation, we simulated a broken traffic light at the crossing at Bunsengymnasium, so agents can not cross the road there. As the map shows, agents now have to walk past the Mathematikon to cross the street. That leads to higher traffic in that area.
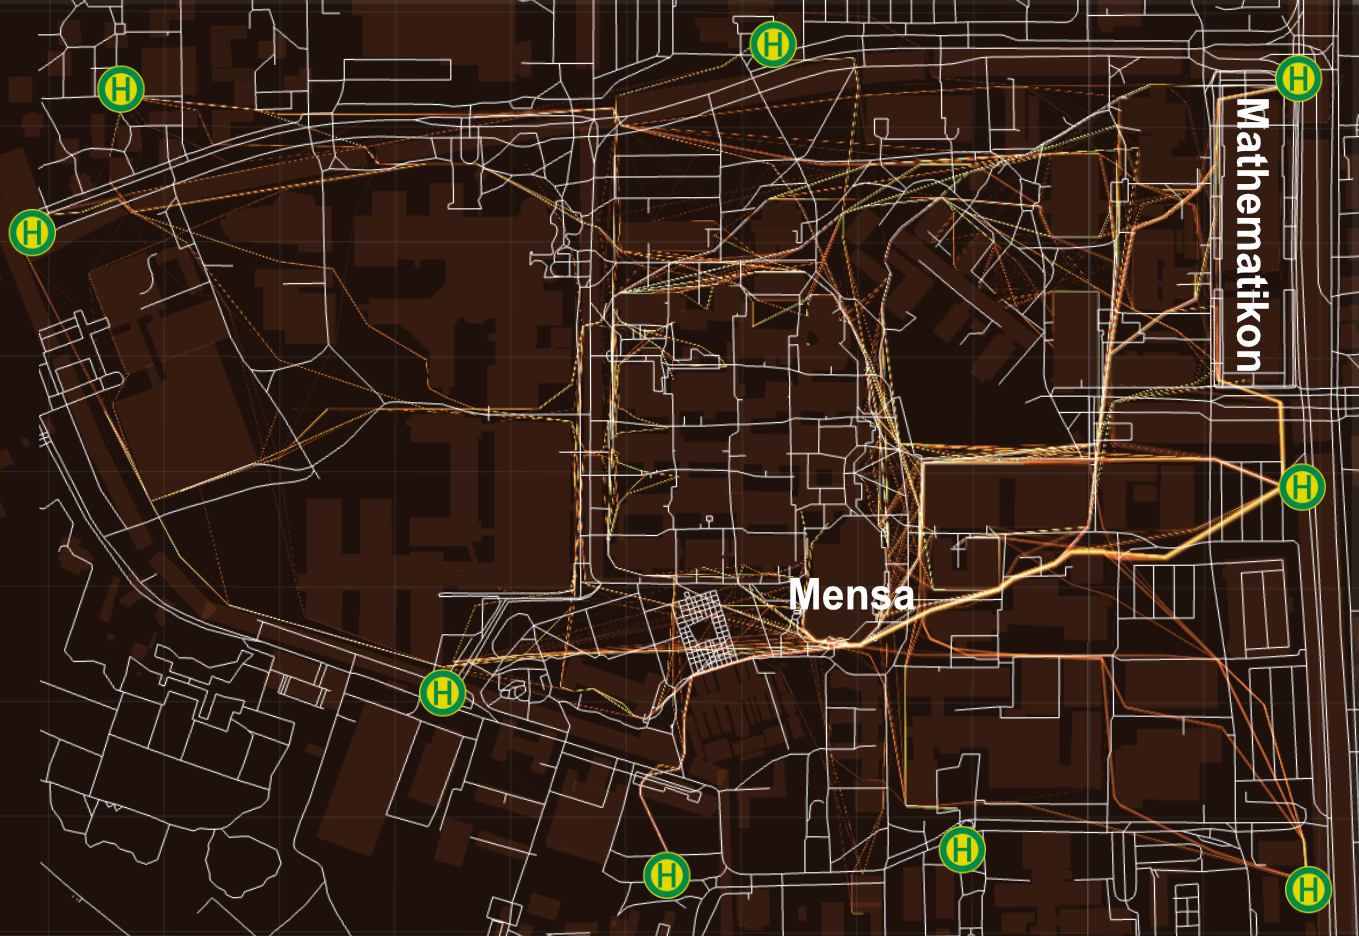
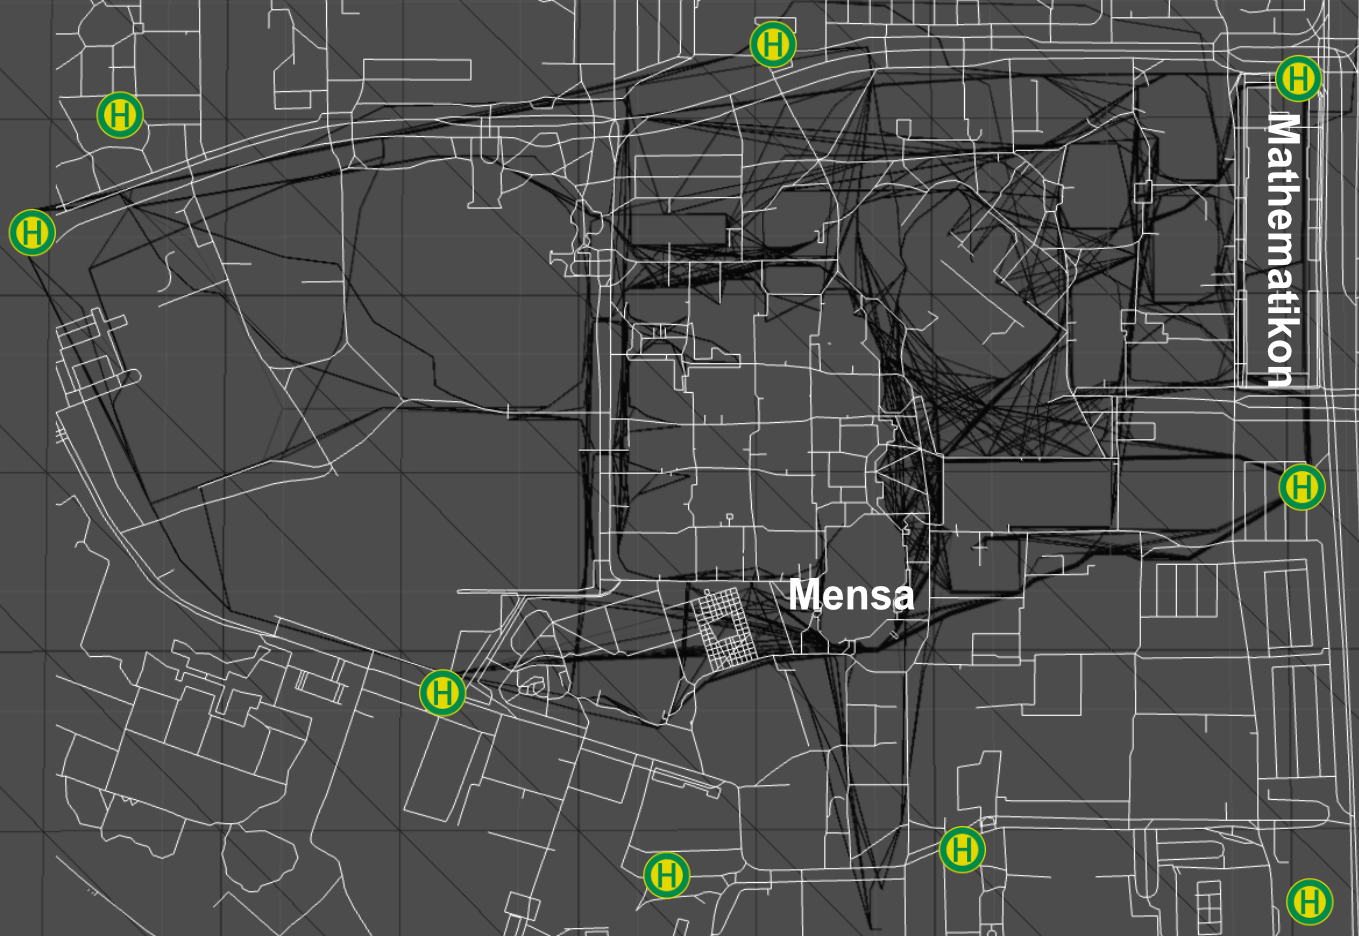
As the new Audimax is currently under construction we thought that would be an interesting scenario to simulate. The construction site is blocking most of the square in front of
the Theoretikum. To make the simulation more realistic the area was blocked before the paths were calculated. In our opinion, that makes sense because once someone knows that
there is a construction site, he will not walk there every day and be surprised by it. So the agents are prepared for the obstacle and can prepare beforehand to walk another route.
The consequences of this behavior are nicely visible in the picture. All traffic that would go through the construction site is now pushed into a small corridor in front of the
Kirchhoff Institute. And anybody who was recently there at busy times knows, that sometimes this is pretty accurate.
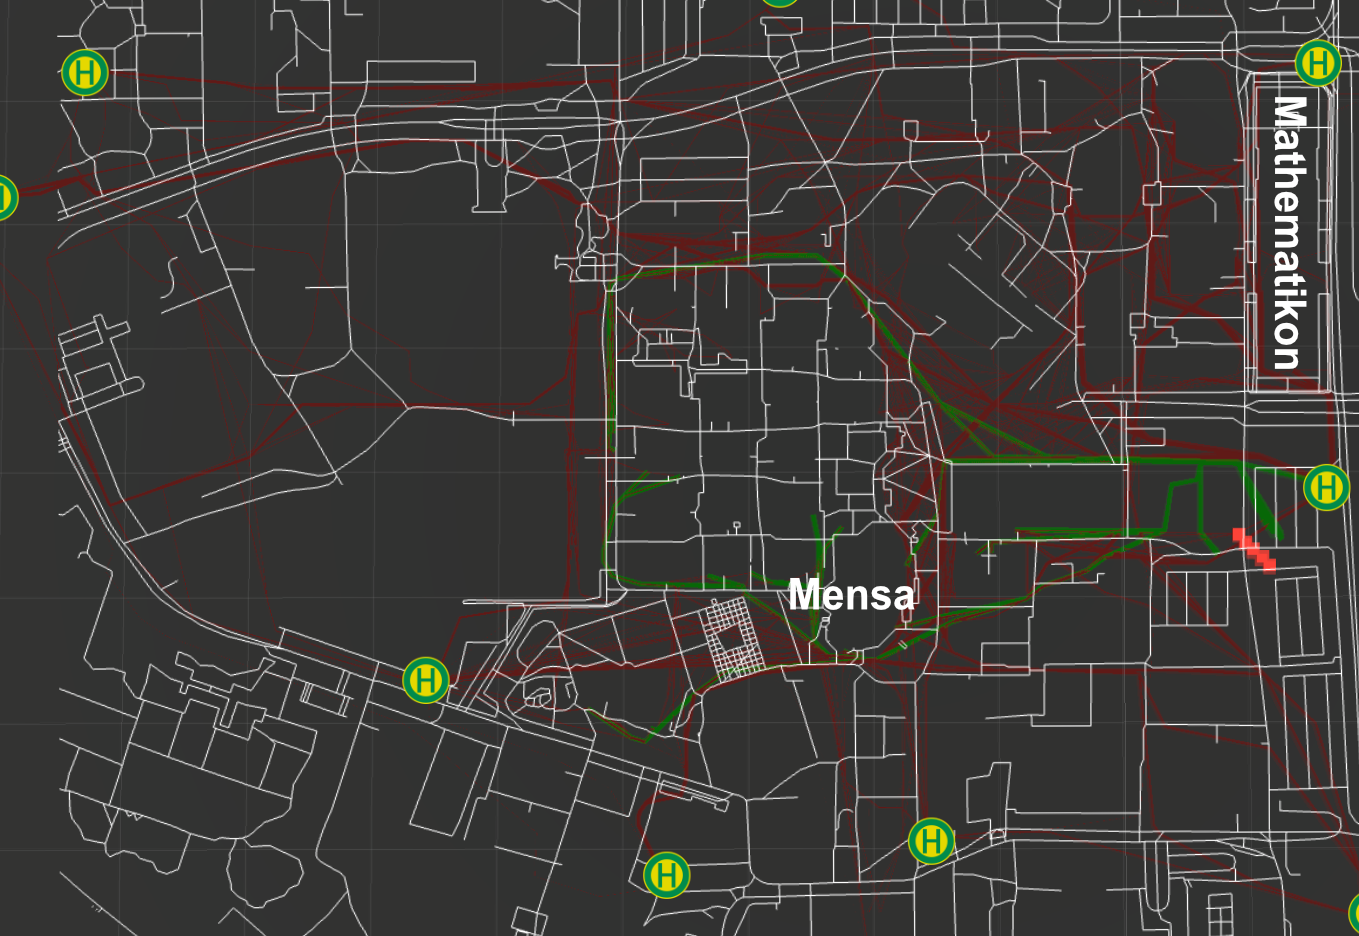
This simulation simulates a case of emergency. The difference between the construction site simulation and this one is that, in an emergency, no one knows that a path is blocked
beforehand. To simulate this, we gave the agents the ability to look ahead and recognize if an obstacle is in their way. If this happens they calculate a new path around the obstacle,
just like one would do in an actual situation.
On the map, there are now two different colored paths. The red paths were not influenced by the obstacle. The green ones, on the other hand, are paths that were calculated as a result
of the emergency. The red bricks work as an obstacle and were placed around 11:00, so the students visiting the 11:15 lecture might have to walk around it. That results in some
interesting narrow paths between buildings, which are now the shortest, and some even walking a very different route around the north side of the Theoretikum.
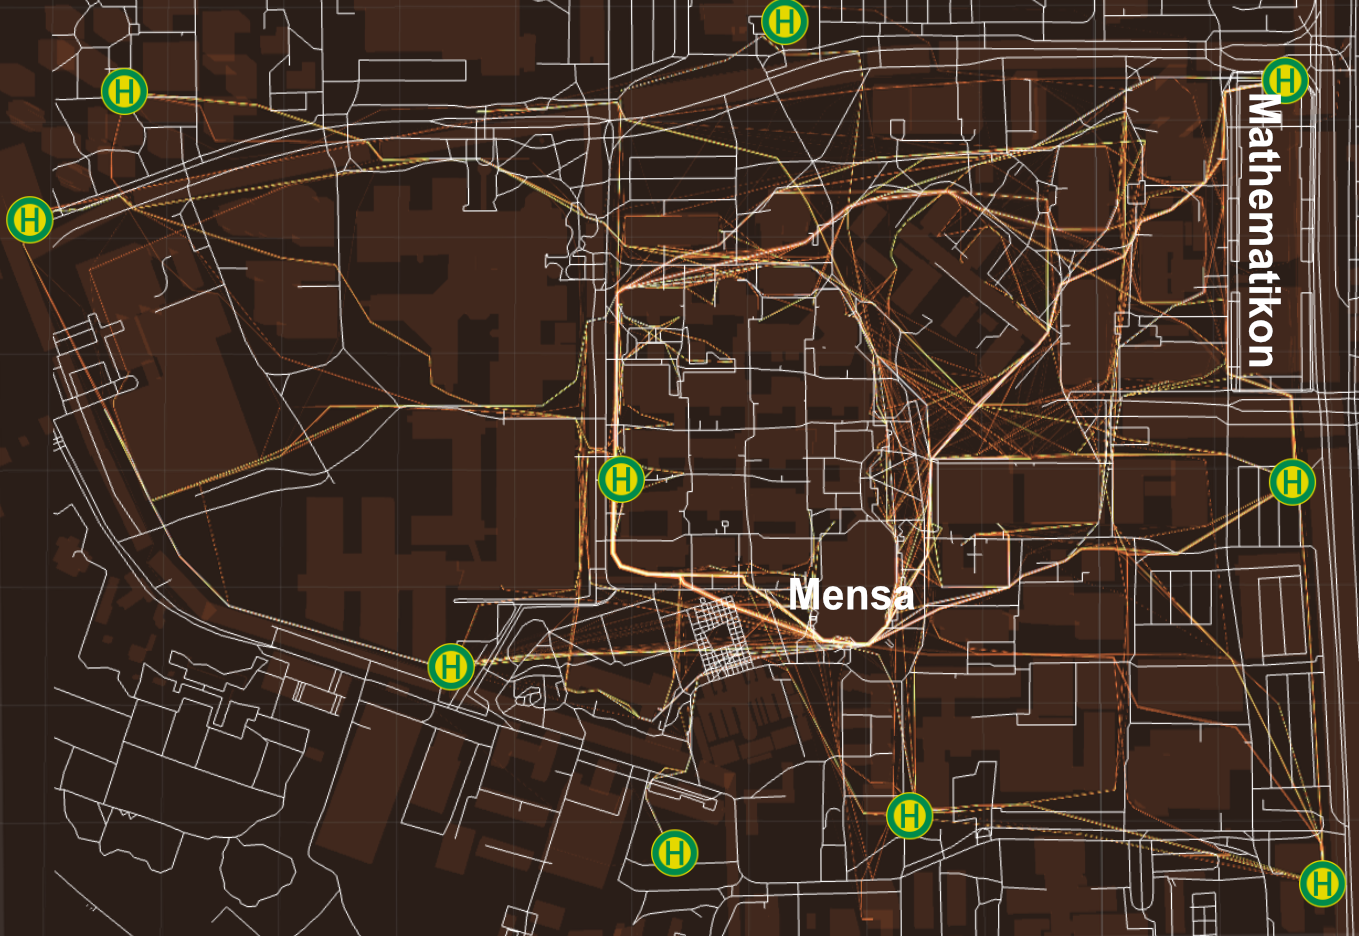
For the last experiment, we added a new bus stop to the campus. The city of Heidelberg had the same idea some years ago, so we tried to find a good accessible,
but still effective, place for the new entrance and exit. As you see on the map and might know as a visitor of the campus, the bus stops all circle the campus.
The best spot in our opinion was on the west side of the Theoretikum because, on one hand, it is quite central and on the other, it is still reachable
by a bus, although there might be some changes necessary.
And as you see on the map, it shifts the busiest paths to the center and relieves the western streets a little more.
Now we take a look at the performance of the model in in-game time. Keep in mind a short drop in FPS can take much longer, cause the simulation is getting slower. But this way we can better compare the different models, even if between two runs is a minute-long difference. Our test system was a Macbook Air with an M1 processor, and we tested after Unity supported the ARM architecture native. We had some runs before this update, but the performance was underwhelming. In some cases, the simulation just stopped completely for the new calculations.
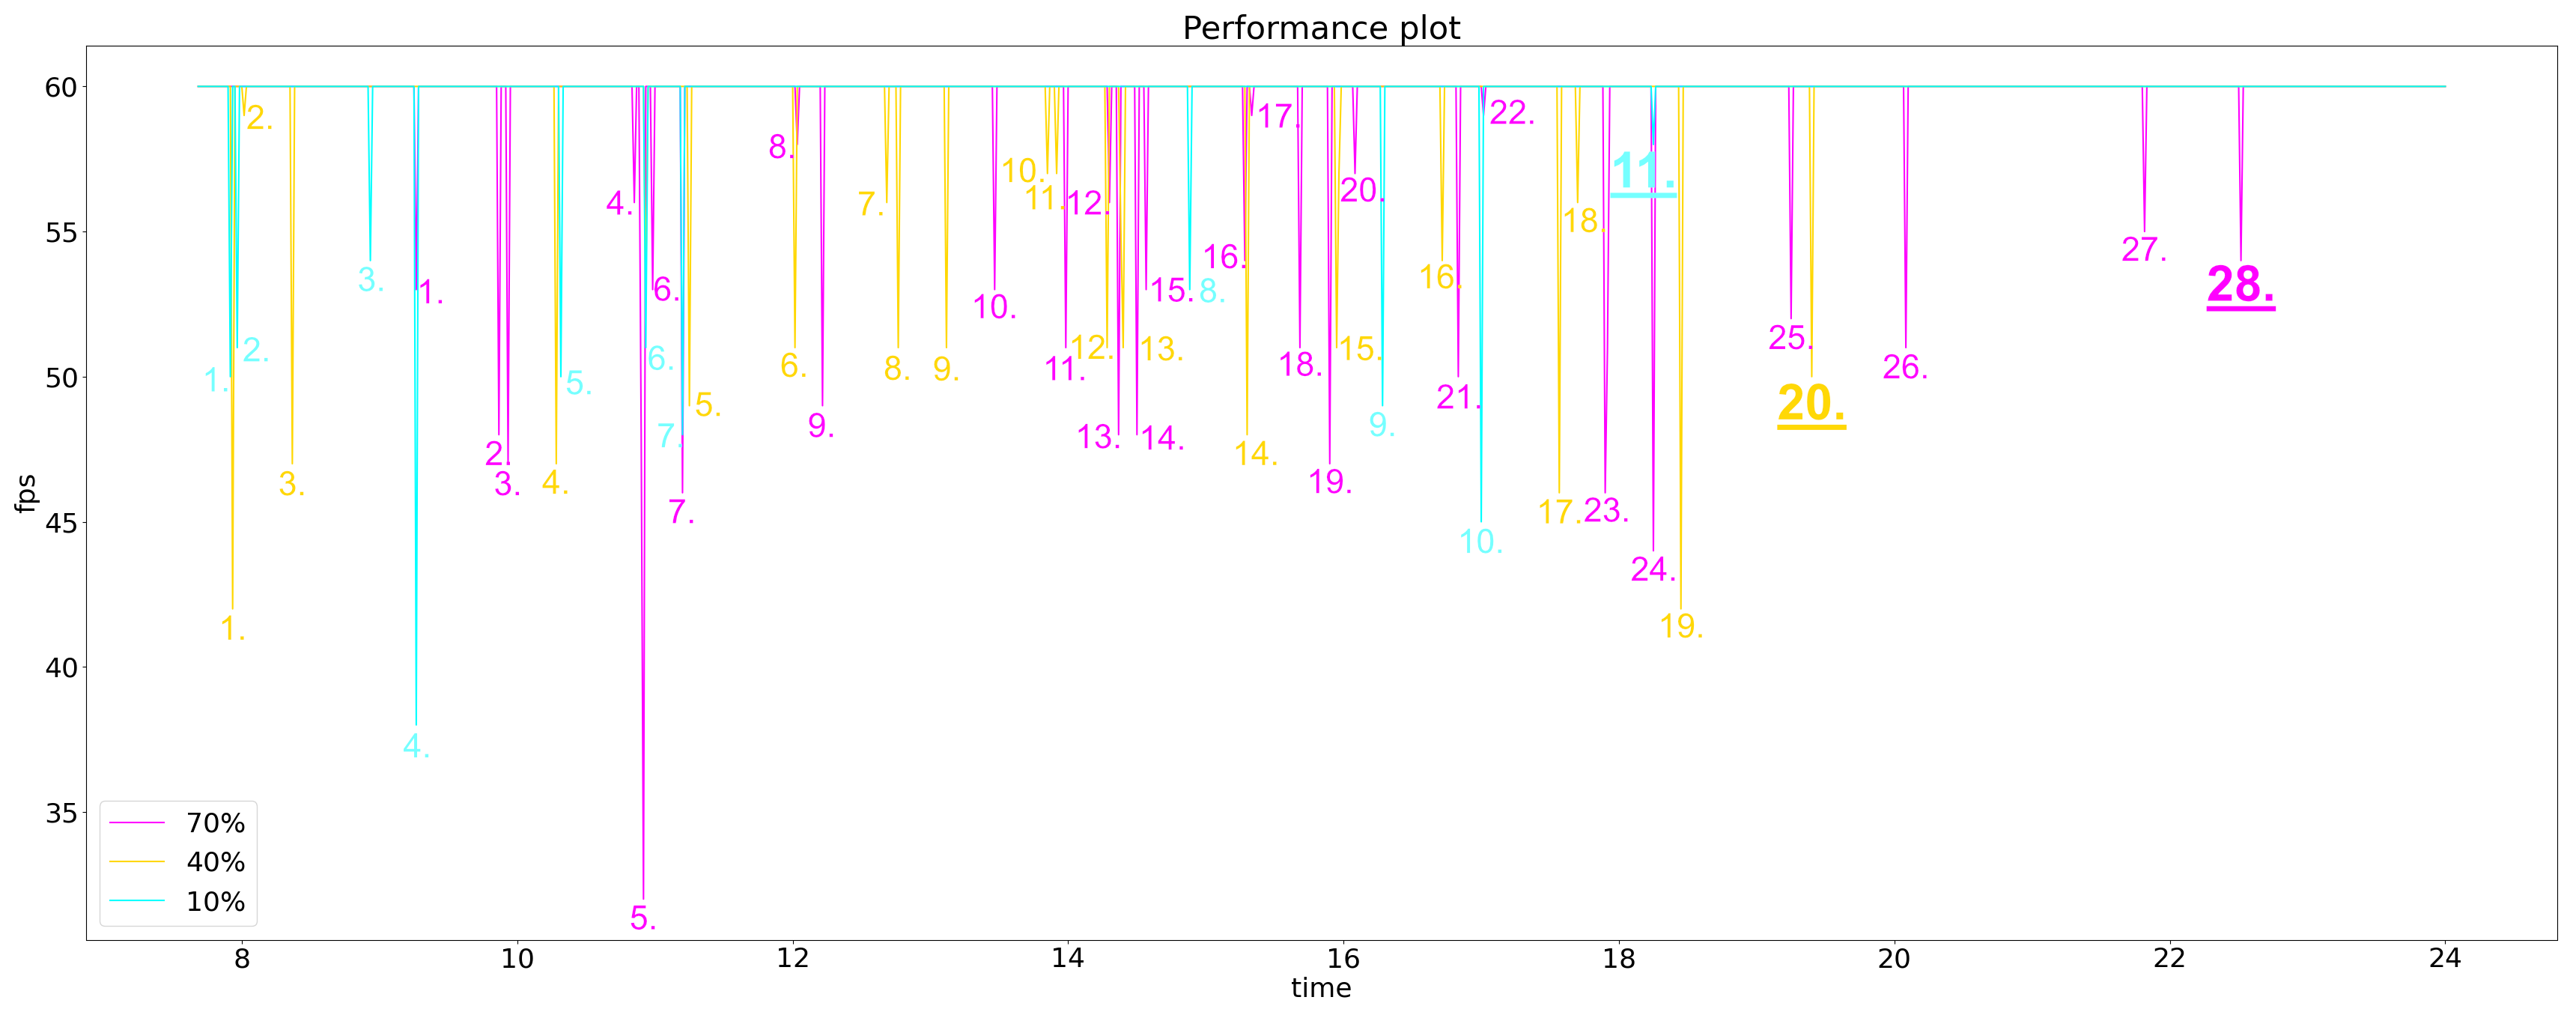
At first, we watch the performance in dependency of the attending students. We can see sporadic dips that get more severe the more students we simulate. And, as aforementioned, the framerate drops significantly at critical times, for example, around 11:00.
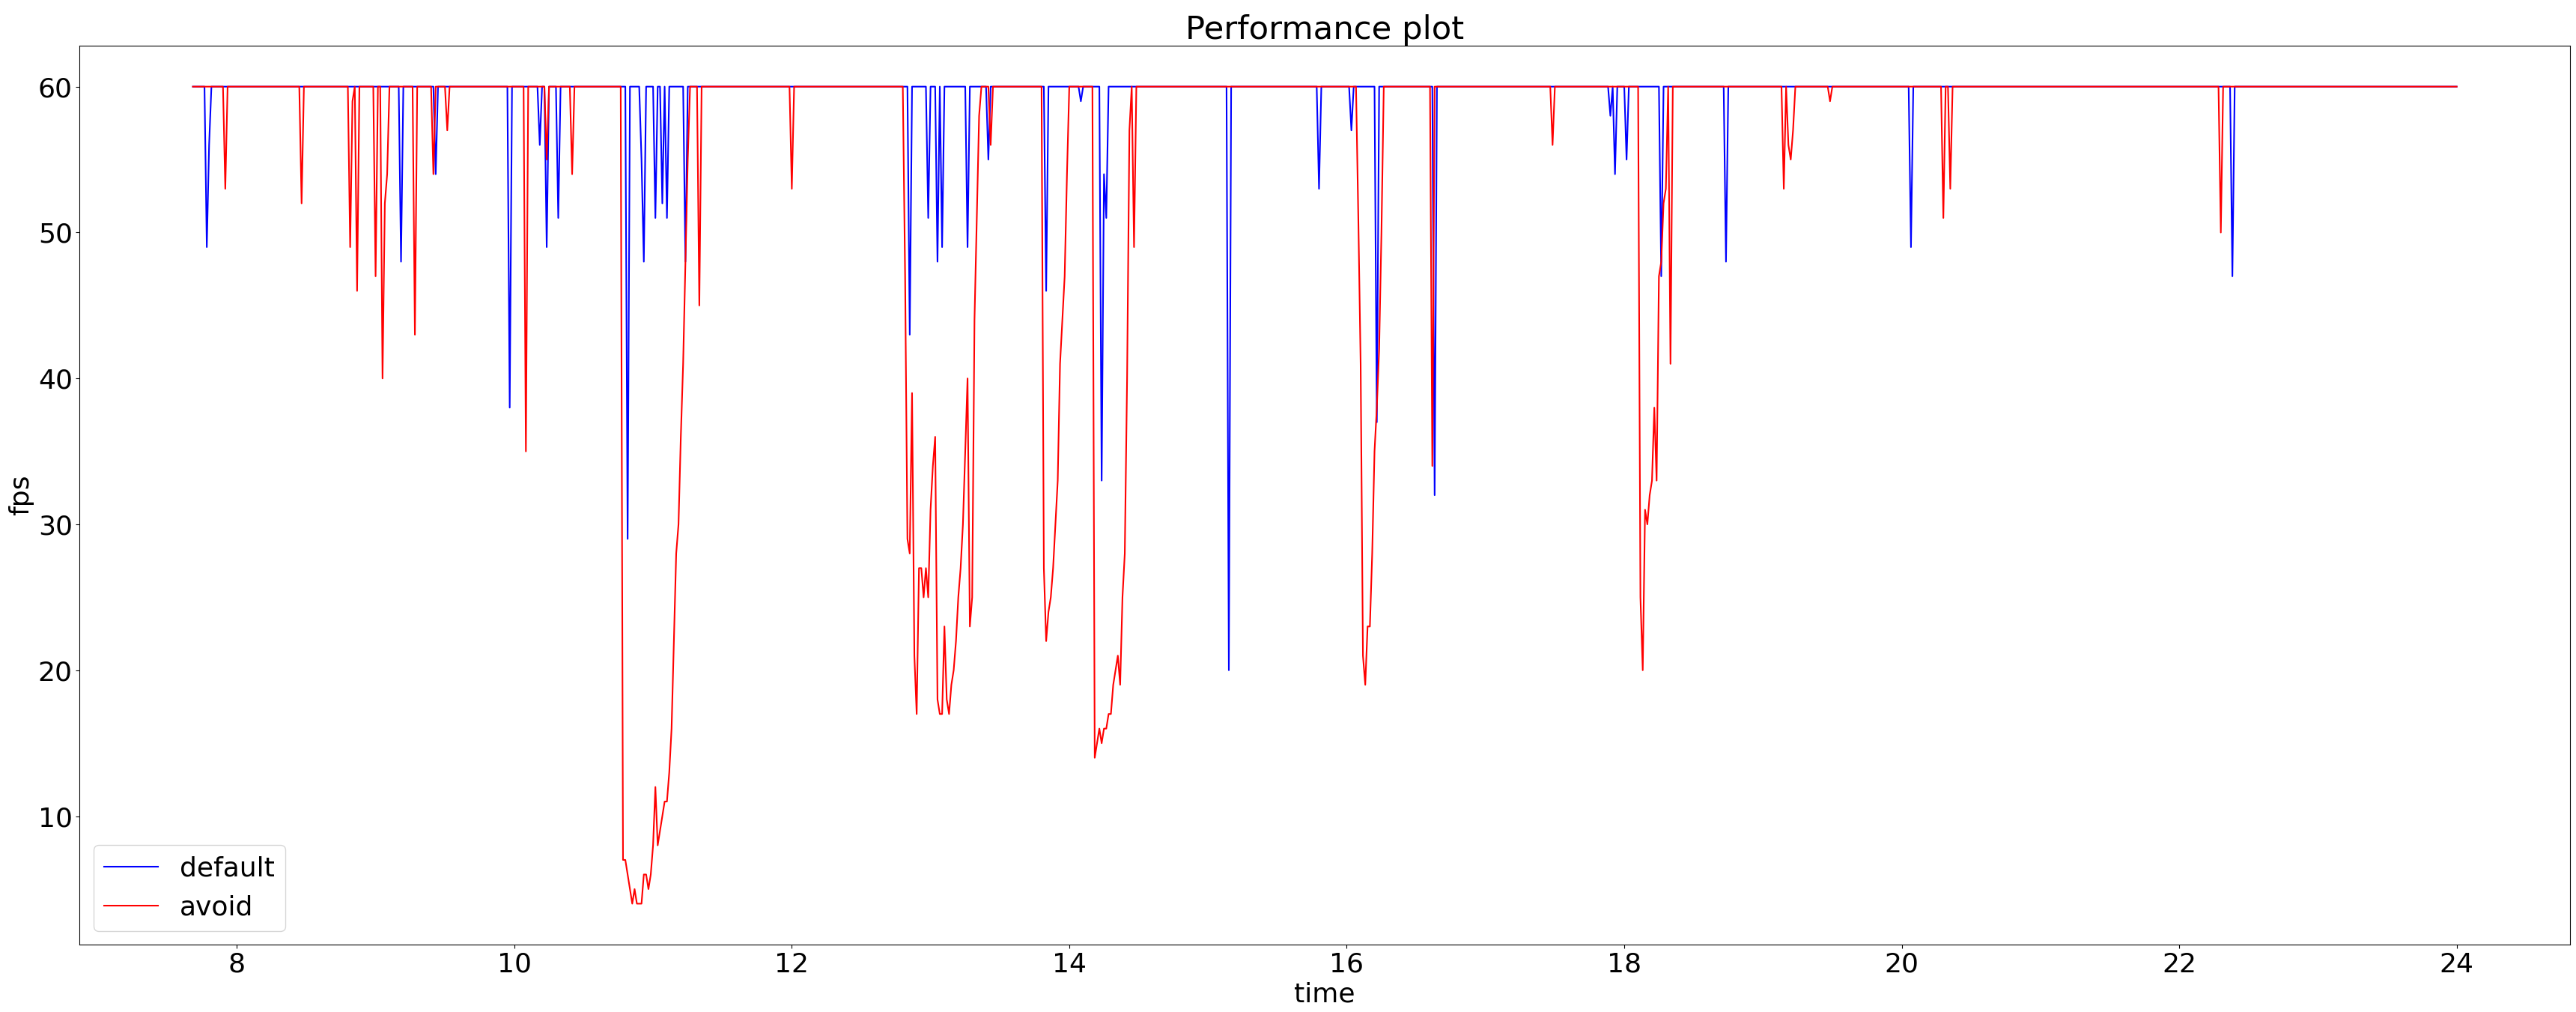
As mentioned above, we could let the students watch out for each other and avoid collisions, which comes with a lot more calculations. With the scale in mind, we can see that the dips are not only last for a longer time but also the overall framerate is much lower.